|
GEOGRAPHY
Review Notes
Everything we studied — in one place
A complete revision guide built from the 65-page class packet (习题.pdf):
concepts · diagrams · examples · self-tests · answer key
WHAT IS INSIDE • 10 chapters, re-ordered by topic but covering every page except p 24 (unreadable photo). • 25 diagrams and maps, including a full North America map series and a detailed rock cycle. • Corrections for the contradictions found in the packet, flagged in 'Check & correct' boxes. • Worked examples marked 'Suggested' or 'Example', plus a self-test and a separate answer key. |
Prepared for Keira · November 2026 · Study copy
Source: 习题.pdf (CamScanner, 65 pages). Page references throughout are PDF page numbers, not handwritten dates. Diagrams redrawn for this guide unless credited otherwise.
How to use this book
This guide follows the exam scope written on p 53: all topics covered. There is no shortened syllabus, so the book is organised by theme rather than by the order of the packet. Each chapter uses the same five-part rhythm, so you always know where you are.
The five-part chapter structure
Section | What it does | How to revise it |
Core concepts | Definitions and explanations, with the source page for every fact. | Read once, then cover and say it aloud. |
Diagram | A redrawn figure with every label the packet requires. | Copy the figure from memory, then check the labels. |
Links & pitfalls | How the idea connects to other chapters; the mistakes marked in the packet. | Make a two-column 'right / wrong' list. |
Worked example | A model answer, labelled Example or Suggested. | Cover the answer and write your own first. |
Self-test | Questions in the exam formats: MCQ, gap-fill, grouping, mapping, diagram, short analysis. | Do it closed-book; mark with the answer key at the back. |
The page tags. Every paragraph or bullet ends with the PDF page it came from, e.g. (p 34). Where two pages disagree, the note says so and a Check & correct box explains which version to use.
Three kinds of example. The packet contains student answers, teacher comments and blank tasks. This book keeps them apart:
- Source example — an answer that already existed in the packet; reproduced with its page.
- Example — a new worked example written for this guide, using the same method.
- Suggested / added — practice that did not exist in the packet, including verified answers to blank questions. These are never presented as the student's own work.
A NOTE ON THE PARK INITIALS p 52 asks about GD / DV / BC national parks but never gives their full names. The initials are kept exactly as written and only the two shaping forces the page states — tectonic uplift and erosion — are recorded. No full names are guessed. |
Abbreviations used in the guide. HEI = human–environment interaction. NA = North America. MYA = million years ago. BP = before present. RF = Richter magnitude (the packet's 'Richter scale'). The park initials GD, DV and BC are left unexpanded on purpose.
Contents
In Word: right-click the table below and choose Update Field to refresh page numbers.
CHAPTER 1
Geographical Thinking & Mapping
Definitions · five themes · regions · location · maps and projections
Source pages: pp 1–5, 44, 50–51, 53–55, 62
Geography is the subject that asks where things are, why they are there, and what difference their location makes. The packet builds that idea from three directions: the definitions (pp 4, 50), the five themes used to organise any place (p 1), and the map skills needed to show it all (pp 3, 5, 51, 62). This chapter puts those pieces together.
1.1 What geography studies
- Geography is the study of the Earth's surface, the processes that shape it, and the relationship between people and their environments. It is a social science that also uses physical science, so it sits between the natural and social sciences (pp 4, 50).
- Physical geography studies the natural environment: landforms, rocks, weather and climate, water, soils and ecosystems.
- Human geography studies people: cultures, societies, economies, settlement, population and the way people use space.
- Regional geography pulls both together for one area, asking what makes that place distinctive.
- Geography is interdisciplinary: it borrows from geology and geochemistry to explain landforms, from economics to explain trade, and from philosophy and politics to explain how people value places (p 50).
- The subject's core questions are about spatial distribution, scale, interaction and change: what is where, at what scale, how places connect, and how they are changing (p 50).
"PLACE, SPACE AND SCALE" Place is a location with meaning attached — physical characteristics (landforms, climate, vegetation) plus human characteristics (culture, economy, buildings, language) (p 4). Space is the raw arrangement of things; scale is the level at which you study it (local, regional, national, global). The same question looks different at a different scale — a drought is a local crop failure and a global food-price story at the same time. |
1.2 The five themes
The five themes are the packet's main tool for describing any place (p 1; also used on pp 9, 37, 45, 49, 63):
1. Location — where it is: absolute (coordinates) or relative (compared with something else).
2. Place — what it is like: physical and human characteristics that make it distinctive.
3. Region — an area sharing one or more characteristics; regions can be formal, functional or perceptual.
4. Human–environment interaction (HEI) — how people modify, adapt to and depend on their environment.
5. Movement — the flow of people, goods and ideas, and the distance involved.
HEI in three verbs (p 1):
- Modify — change the environment: build houses, dams, roads; clear forest.
- Adapt — adjust to it: air conditioning and heating, sunglasses, different clothing.
- Depend — rely on it: fishing, crops, oxygen, fresh water.
Movement and distance (p 1): three kinds of distance matter. Linear distance is measured in km; time distance is how long the journey takes; psychological distance is how far away a place feels. A nearby place can feel far, and a distant one can feel close, which is why people's mental maps differ from real maps.
1.3 Three kinds of region
Type | What holds it together | Example from the packet |
Formal | A shared measurable characteristic (climate, language, culture, landform) | A tropical-climate region; Latin America as a cultural region |
Functional | A node and the area it serves — movement and connection | A city and its commuting area; a river basin draining to one outlet |
Perceptual | People's subjective image; boundaries vary from person to person | "The South", "the Midwest", "Trump country", a school's catchment image |
A formal region has relatively clear boundaries (climate zones), a functional region is organised around a centre (a city, a port, a river basin), and a perceptual region has no official border at all — its edge depends on who you ask (pp 1, 4, 55).
"CHECK & CORRECT — CLASSIFICATION CAN BE ARGUED" p 55 lists Silicon Valley, the American South, France and the Pearl River Delta as region examples without saying which type each one is. Do not force one label onto all of them. Silicon Valley is best read as a functional region (a linked innovation network), the American South as a perceptual one (a shared image), France as a formal state territory, and the Pearl River Delta as a functional economic region. Any answer is defensible if you give the criterion you used. |
1.4 Location: relative and absolute
- Relative location describes where something is compared with something else: "north of the Columbia River", "south of Seattle" (p 38).
- Absolute location gives a fixed grid position: latitude and longitude (p 1), or a street address.
- Latitude measures north–south position: the angle between the equator and the point, measured from Earth's centre. It runs 0° at the equator to 90°N and 90°S at the poles. Lines of latitude (parallels) are parallel and never meet.
- Longitude measures east–west position: the angle from the prime meridian (Greenwich, 0°) to the point, 0° to 180° east or west. Lines of longitude (meridians) converge at the poles, so the distance between them shrinks towards the poles.
- 1° of latitude ≈ 111 km everywhere. One degree of longitude ≈ 111 km at the equator but much less at high latitude.
- GPS (Global Positioning System) uses satellites to give absolute location; GIS (Geographic Information System) layers location data so that different kinds of information can be compared and mapped (p 3).
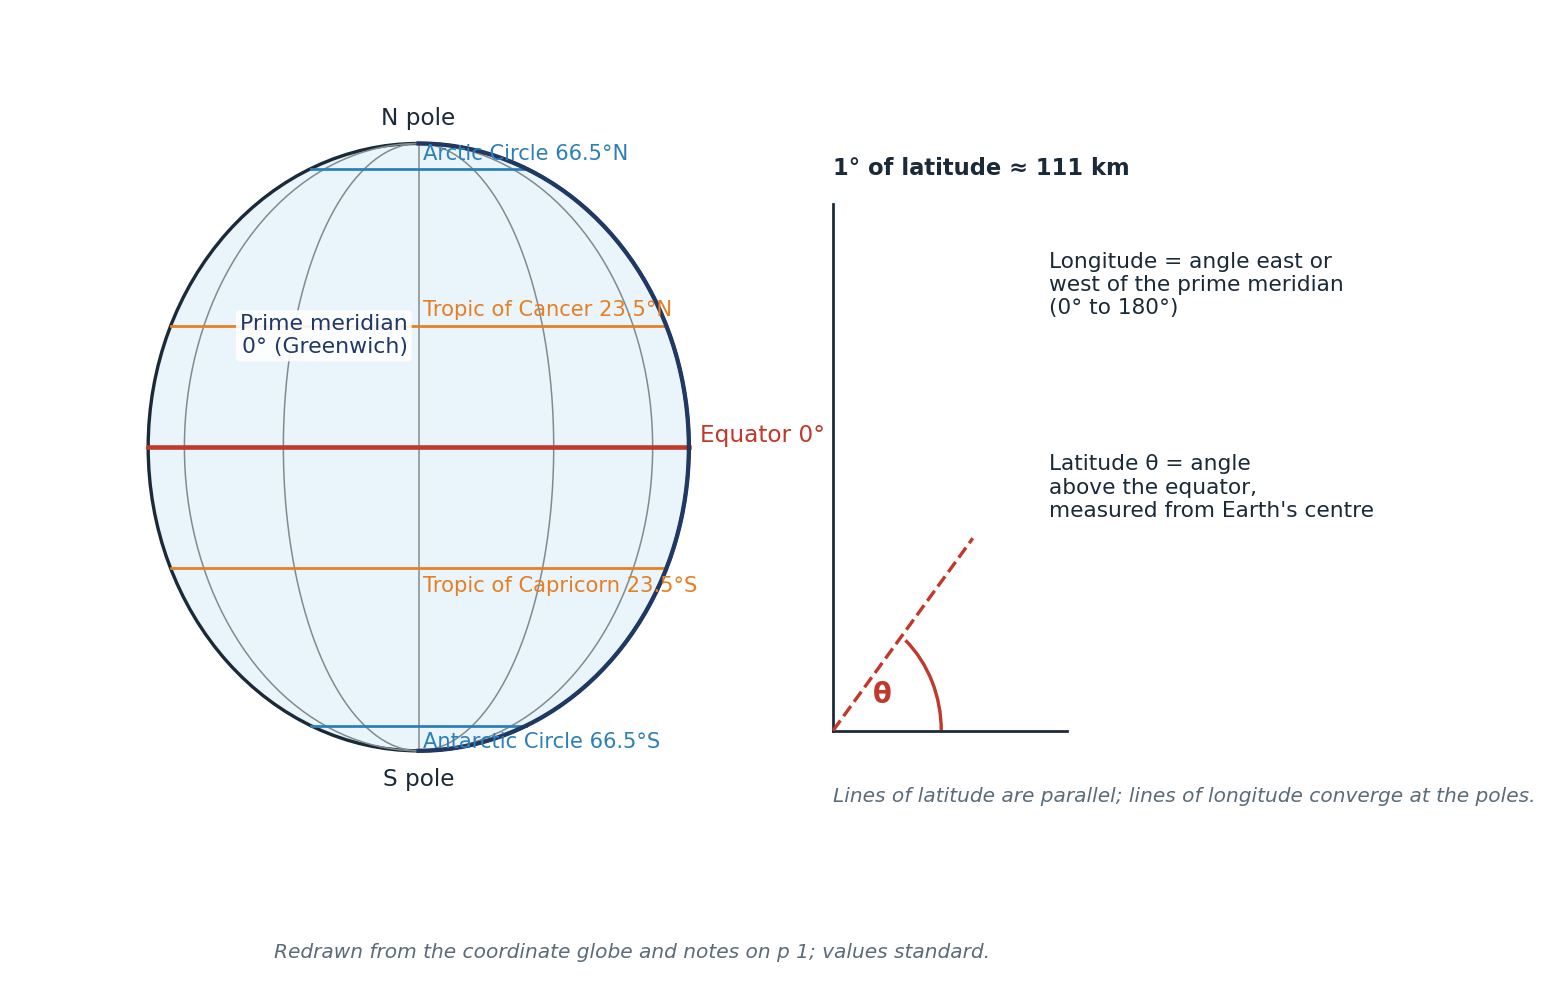
Figure 1.1 Latitude, longitude and the reference lines of the globe. Redrawn from p 1; standard values verified.
"CHECK & CORRECT — LATITUDE AND LONGITUDE WORDING" The p 1 note is compressed and clipped at the right edge. It is easy to memorise the wrong way round. Fix the wording: latitude is measured from the equator (0–90° N/S); longitude is measured from the prime meridian (0–180° E/W). Lines of latitude are parallel; lines of longitude converge at the poles. |
1.5 Tools: observation, survey, GPS, GIS
- Direct observation — fieldwork, measuring and recording on site.
- Surveying — measuring distances, angles and heights to map an area precisely; contour lines on a topographic map show height and slope (p 3).
- Interviews and data/statistics — asking people, and using numbers collected by others.
- Indirect observation — aerial photographs, satellite images and drone images; these show patterns too large or too dangerous to see from the ground (p 3).
- The method is always observe → measure → record, then map or graph the result.
- Mental maps are the maps in our heads, built from experience and perception; they explain why people misjudge distances and directions (p 3).
1.6 Maps: types and elements
Types of map (pp 3, 51):
- Political — shows borders, states and cities.
- Physical — shows landforms: mountains, rivers, coasts, relief.
- Physical-political — both relief and borders (the standard classroom map).
- Thematic — shows one theme: climate, vegetation, population density, economic activity.
- Cartogram — distorts the size of areas in proportion to data (e.g. population), so the shape is deliberately wrong.
Parts of a map (p 3): title; key/legend; compass rose or north arrow; symbols; labels; a locator map; latitude and longitude grid; colour; scale.
Scale describes how much the real world is shrunk:
- Large-scale map (e.g. 1:10,000) — small area, lots of detail.
- Small-scale map (e.g. 1:10,000,000) — large area, little detail.
- Scale can be written as a ratio (1:50,000), a word statement ("1 cm = 1 km"), or a line scale.
"CHOOSING A MAP (P 51)" Ask two questions: what is being shown (a theme or a physical base?) and how much detail is needed (large scale for a neighbourhood, small scale for a continent). Then check the map elements. The packet's five scenarios all resolve this way: westward expansion → political/physical maps plus a historical map; global coffee trade → economic map; Rockies fieldwork → physical-political map; rainforest biodiversity over time → vegetation maps at two dates; farm help in sub-Saharan Africa → climate and economic maps. |
1.7 Projections: flattening a sphere
Every map is a compromise because a sphere cannot be flattened without distortion. A projection can preserve area, shape, distance or direction — never all four at once (pp 2, 5).
Projection family | How it is made | Best for | Main distortion |
Cylindrical / Mercator | Paper wrapped as a cylinder around the globe | Navigation (straight lines = compass bearings) | Area exaggerated towards the poles: Greenland looks as big as Africa |
Planar / azimuthal | Paper plane touching the globe, usually at a pole | Polar regions; true direction from the centre | Shape and area distorted at the edges |
Conic | Paper cone over the globe | Mid-latitude countries (e.g. USA, Europe) | Distortion away from the contact line |
Interrupted / homolosine | Globe cut and flattened in sections | World maps where area matters | Shape and continuity broken at the cuts |
Robinson | Compromise projection | World maps for display | Some distortion of everything, but nothing extreme |
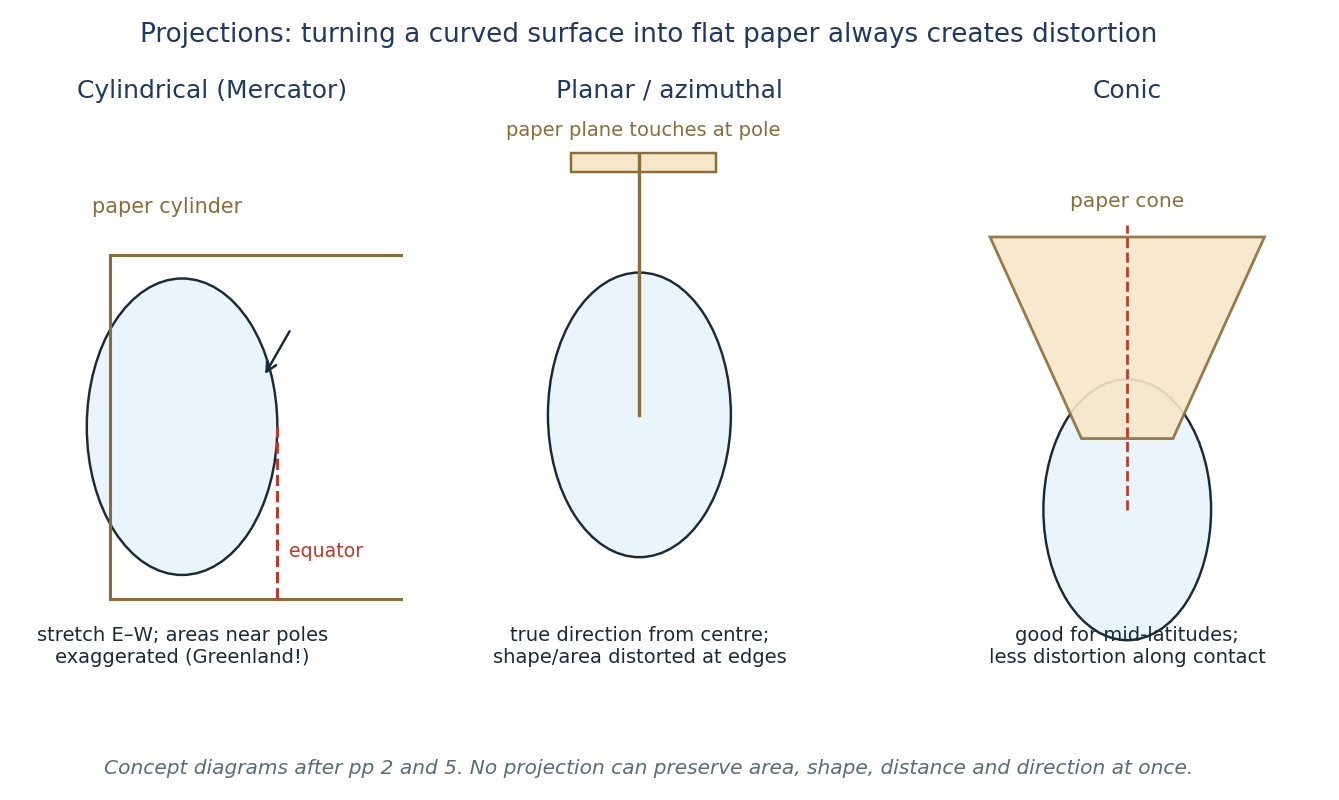
Figure 1.2 The three classic projection families. Redrawn from pp 2 and 5; the Greenland–South America comparison is the standard test of Mercator distortion.
"CHECK & CORRECT — PROJECTION NAMES (P 5)" The p 5 notes group cylindrical under "compromise" projections. That is wrong: Mercator is a cylindrical projection, not a compromise one. Robinson is the compromise world projection on p 2. Keep the two separate in an exam answer. |
"CHECK & CORRECT — THE DATE LINE (P 53)" The exam-scope note says "180° longitude / date line". They are not the same line: the International Date Line roughly follows 180° but zigzags around countries (e.g. Kiribati, Samoa) so that a single country is not split across two dates. Say "about 180°", not "exactly 180°". |
1.8 Worked example — coordinates and scale
"EXAMPLE — PLOT AND DESCRIBE A LOCATION" Task. Plot Reykjavik (64.15°N, 21.94°W) and Helsinki (60.17°N, 24.94°E) on the European graticule (p 62), then describe their relative location. Method. 1. Latitude first: find 64°N along the left edge, then go slightly above it (0.15° ≈ 17 km). 2. Longitude next: from the prime meridian go west 21.94° for Reykjavik, east 24.94° for Helsinki. 3. Mark the crossing point and label it. Answer. Reykjavik is an island capital in the North Atlantic, just south of the Arctic Circle, about 21.9° west of Greenwich. Helsinki is on the Gulf of Finland, about 24.9° east, at a similar latitude (60.2°N). Reykjavik is therefore west and slightly north of Helsinki; the two are roughly 3,300 km apart. Scale check (Suggested). On a 1:50,000 map, 4 cm represents 4 × 50,000 cm = 200,000 cm = 2 km. On a 1:25,000 map the same 4 cm represents 1 km — twice the detail, half the ground covered. |
"EXAM TIP — DESCRIBE, THEN EXPLAIN" A location question earns marks for specific description ("46°N, 122°W", "south of Seattle", "on the Cascades arc"), not for "it is in the north". Always give the grid reference if the map has one, then a relative description, then say what the location explains (climate, hazard, trade). |
1.9 Self-test
1. Define geography in one sentence, and name the two main branches.
2. List the five themes and give one example of each for your own town.
3. Classify each region and say why: (a) the tropics, (b) a city's commuter belt, (c) "the Midwest".
4. Give one example each of people modifying, adapting to and depending on the environment.
5. Explain the difference between relative and absolute location, using Mount St Helens.
6. Why does 1° of longitude represent a shorter distance near the poles than at the equator?
7. Name four things every good map should have.
8. A map is 1:250,000. How many kilometres does 6 cm represent?
9. Give one advantage and one disadvantage of a Mercator map.
10. Explain why a cartogram is useful and why it looks strange.
"SUGGESTED PRACTICE — MAP CHOICE" A geography class is studying coffee farming around the world. Which two maps would you choose, and why? (Suggested: an economic/agricultural thematic map to show where coffee is grown, plus a climate map to explain the growing conditions — tropical highlands with reliable rain. A political map alone shows borders but not the pattern.) |
CHAPTER 2
Earth in Space & Earth's Structure
Planet criteria · Solar System objects · spheres of the Earth · layers inside
Source pages: pp 2, 15, 34, 60, 65
To understand plates, volcanoes and landscapes you first need the whole planet: where it sits in space, what it is made of, and how its layers behave. This chapter covers the "big picture" facts the packet tests in Quiz 2 (p 65) and the Earth-structure notes (p 34).
2.1 What makes a planet
The packet lists three criteria (p 2):
1. It orbits a star (the Sun).
2. It is large enough for gravity to make it spherical.
3. It has cleared its orbit of other objects of comparable size.
Pluto fails the third criterion, which is why it was reclassified as a dwarf planet. The packet's criteria are the standard IAU definition, so they are safe to use.
- Mercury and Venus have no moons (p 2).
- The Solar System has eight planets, a belt of asteroids between Mars and Jupiter, and comets on long orbits.
- Asteroids are rocky or metallic chunks, mostly in the asteroid belt.
- Comets are bodies of ice, dust and rock; when they come near the Sun the ice vaporises and forms a tail pointing away from the Sun.
- Meteoroid → meteor → meteorite (p 60): a meteoroid is a small rock or metal fragment in space; a meteor is the streak of light when it burns up in the atmosphere; a meteorite is the fragment that survives and lands on the ground.
- Telescopes and probes: Hubble and James Webb observe from space; the Voyager probes have left the inner Solar System; thousands of satellites orbit Earth (p 2). Treat the exact Voyager distance as out of date — it changes every year.
"CHECK & CORRECT — SPACE FACTS THAT AGE" The p 2 note says Voyager has reached a certain distance. Any such figure is a snapshot, not a fact to memorise. Write "Voyager is now in interstellar space, more than 20 billion km away" and move on. The same applies to the number of known moons of any planet — it changes as new ones are found. |
2.2 Earth's four spheres
The packet introduces four overlapping systems (p 2):
- Lithosphere — the solid outer shell: crust and rigid upper mantle; the plates.
- Atmosphere — the layer of gases around Earth (nitrogen, oxygen, argon, carbon dioxide, water vapour).
- Hydrosphere — all the water: oceans, lakes, rivers, ice, groundwater.
- Biosphere — all living things and the parts of the other spheres they use.
They interact constantly: the atmosphere weathers the lithosphere, the hydrosphere erodes it and carries sediment, and the biosphere (roots, lichens, humans) breaks and binds it. Soil is the clearest product of all four spheres meeting.
2.3 Two ways to divide the Earth
Geologists divide the interior in two different ways (p 34, and the diagram in Quiz 2 on p 65):
Compositional layers | What they are made of | Mechanical layers | How they behave |
Crust | Silicate rock; continental crust is thicker and lighter, oceanic crust thinner and denser | Lithosphere | Rigid; crust + upper mantle; broken into plates; about 10–200 km thick |
Mantle | Silicate rock rich in oxygen, silicon, magnesium and iron | Asthenosphere | Soft solid that can flow very slowly; allows plates to move |
Outer core | Liquid iron and nickel | Mesosphere (lower mantle) | Solid, under high pressure |
Inner core | Solid iron and nickel | Outer core | Liquid; generates the magnetic field |
— | — | Inner core | Solid, extremely high pressure |
Key numbers from p 34:
- Continental crust: 10–70 km thick. Oceanic crust: 5–7 km thick.
- Lithosphere: 10–200 km.
- Boundary depths: 660 km (lithosphere–asthenosphere), 2,900 km (mantle–outer core), 5,150 km (outer–inner core).
- Earth's radius ≈ 6,371 km.
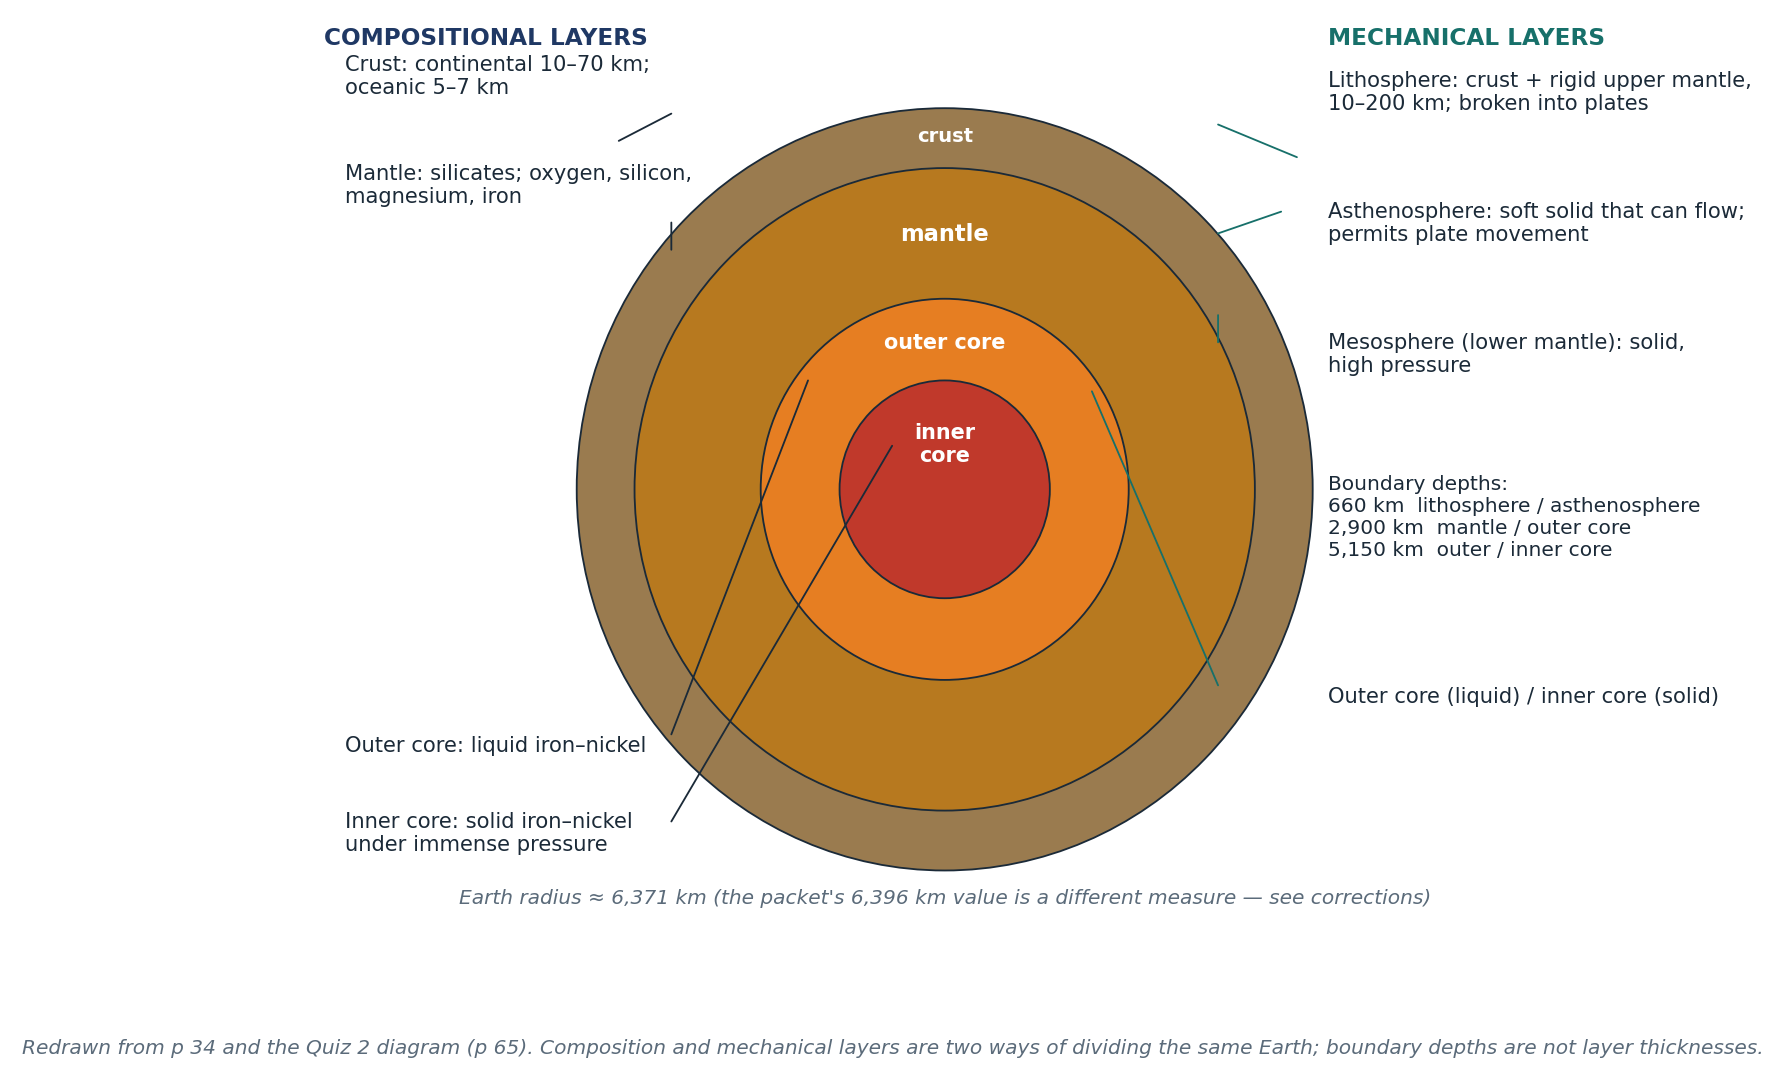
Figure 2.1 Compositional and mechanical layers of the Earth, drawn as two readings of the same cross-section. Redrawn from p 34 and the p 65 diagram.
"CHECK & CORRECT — THREE ERRORS IN THE LAYER NOTES" 1. Radius. The p 34 note prints "6396 km". The mean Earth radius is 6,371 km; 6,396 km is close to the equatorial radius (6,378 km) and probably a transcription slip. Use 6,371 km and say "about". 2. Crust thickness. The left margin of p 34 is cropped and the continental/oceanic figures look swapped. The correct pairing is continental 10–70 km, oceanic 5–7 km. 3. "Fluid upper mantle" (p 65). The asthenosphere is a soft solid that flows, not a liquid. It flows over very long times, like extremely stiff putty. Only the outer core is liquid. |
2.4 Why the layers matter
- The lithosphere is broken into plates that move on the asthenosphere — this is the foundation of plate tectonics (Chapter 3).
- Convection in the mantle (and the pull of subducting slabs) supplies the energy for plate motion; the packet calls this the "missing driving force" that Wegener could not explain (p 2).
- The liquid outer core generates Earth's magnetic field, which protects the atmosphere from solar wind.
- The crust is recycled: oceanic crust is created at ridges and destroyed at subduction zones, which is why oceanic crust is young and continental crust is old (p 65).
2.5 Earth as a planet that supports life
Quiz 2 asks why Earth supports life (p 65). The answer is a combination of:
- Liquid water — Earth's distance from the Sun keeps water liquid.
- An atmosphere with oxygen and a greenhouse effect that moderates temperature.
- A magnetic field that deflects harmful solar radiation.
- A stable energy source (the Sun) and a rock cycle that recycles nutrients.
2.6 Worked example — reading a layer diagram
"EXAMPLE — IDENTIFY THE LAYER" A diagram shows a layer that is solid, about 100 km thick, and broken into pieces that move. Which layer is it, and how do you know? Answer. It is the lithosphere. Three clues: it is solid (so not the outer core), it is thin relative to the whole Earth (tens to ~200 km), and it is broken into moving pieces (plates). The layer beneath it, the asthenosphere, is a soft solid that flows and allows that movement. |
"EXAM TIP — ALWAYS SAY WHICH CLASSIFICATION" If a question asks about "the layer under the crust", say whether you mean compositional (the mantle) or mechanical (the asthenosphere). Marks are lost when the two schemes are mixed. |
2.7 Self-test
1. List the three criteria for a planet and explain why Pluto fails one.
2. Define meteoroid, meteor and meteorite.
3. Name the four spheres and give one interaction between two of them.
4. Draw and label the compositional layers of the Earth.
5. Draw and label the mechanical layers, and state the state (solid/liquid) of each.
6. Give the thickness of continental and oceanic crust.
7. Why is the asthenosphere able to flow while the lithosphere is rigid?
8. What is the difference between the mesosphere and the mantle?
9. Explain why oceanic crust is younger than continental crust.
10. Give three reasons Earth can support life.
CHAPTER 3
Continental Drift & Plate Tectonics
Wegener's evidence · sea-floor spreading · boundaries · folds and faults
Source pages: pp 2, 10, 14–16, 20, 29, 34, 53, 59, 65
In 1912 Alfred Wegener proposed that the continents had once been joined in a single supercontinent, Pangaea, and had since drifted apart. He had the evidence but not the mechanism. Fifty years later, sea-floor mapping supplied it: the ocean floor is created at ridges and destroyed at trenches, and the plates carrying the continents move with it. This chapter follows that argument from evidence to mechanism.
3.1 Wegener's hypothesis and evidence
Wegener's idea (p 2):
- About 225 million years ago, the continents formed one landmass, Pangaea.
- They have been moving apart ever since, at roughly the speed a fingernail grows.
- Missing piece: Wegener could not explain what force moved the continents, so his theory was rejected at the time.
The evidence (p 2):
1. Continental fit — the coastlines of South America and Africa match like puzzle pieces, especially the continental shelves.
2. Fossils — the same fossils (e.g. Mesosaurus) are found on continents now separated by ocean; that animal could not swim across.
3. Rocks and mountains — matching rock types and mountain belts continue across the Atlantic.
4. Paleoclimate — glacial deposits and tropical plant fossils are found in places whose present climate cannot explain them.
3.2 From drift to plate tectonics
Plate tectonics explains how the continents move (p 59): the lithosphere is broken into plates, and those plates move over the asthenosphere. Three mechanisms work together:
- Mantle convection — hot rock rises, spreads and sinks, dragging plates.
- Sea-floor spreading — new oceanic crust forms at mid-ocean ridges and moves away.
- Slab pull — the dense edge of a subducting plate sinks under its own weight, pulling the rest of the plate.
Evidence for sea-floor spreading (pp 14, 34, 65):
- Age of the ocean floor increases away from ridges; the oldest oceanic crust is much younger than the continents.
- Magnetic stripes on the ocean floor record reversals of Earth's magnetic field, symmetrical on either side of a ridge.
- Mid-ocean ridges are submarine mountain chains with shallow earthquakes and volcanic activity.
- Trenches mark where old crust is destroyed.
"CHECK & CORRECT — DRIFT VS TECTONICS" Quiz 2 (p 65) is right: Continental drift describes the movement; plate tectonics explains the mechanism. Do not use the two terms as synonyms. Wegener = drift; Hess and later sea-floor studies = the mechanism that made drift acceptable. |
3.3 The three plate boundaries
Boundary | Motion | Crust | Landforms and hazards | Examples |
Divergent | Plates move apart | New crust is created | Mid-ocean ridge, rift valley, shallow earthquakes, volcanism | Mid-Atlantic Ridge; East African Rift Valley |
Convergent | Plates move together | Crust is destroyed (subduction) or crumpled (collision) | Trench, volcanic arc, fold mountains, deep earthquakes, tsunamis | Cascades, Andes, Japan, Aleutians; Himalayas |
Transform | Plates slide past each other | Crust is neither created nor destroyed | Shallow earthquakes, linear valleys, offset streams | San Andreas Fault |
Divergent boundaries — two settings
- Oceanic divergence (p 14): the Mid-Atlantic Ridge. Magma rises, new sea-floor forms, mountains build under water, earthquakes are shallow and small, and the ocean widens.
- Continental divergence (p 14): the East African Rift Valley. The crust stretches, normal faults drop blocks, a rift valley forms, with shallow earthquakes and volcanism. If it continues, the rift becomes a new ocean.
Convergent boundaries — three combinations
- Oceanic–continental (p 16): the denser oceanic plate subducts. A trench forms at the boundary; the slab melts at depth; magma rises to make a volcanic arc on the continental plate; earthquakes occur along the slab. Examples: Cascades (Juan de Fuca under North America), Andes (Nazca under South America).
- Oceanic–oceanic (p 16): one oceanic plate subducts under another; an island arc forms. Examples: Japan, the Aleutians, the East Caribbean.
- Continental–continental (p 10): neither plate easily subducts, so the crust folds and faults, thickens and rises into fold mountains. Earthquakes are shallow. Example: the Himalayas (India–Eurasia).
Transform boundaries
- Plates slide horizontally past each other (p 10). Crust is neither created nor destroyed.
- Effects: earthquakes and linear valleys.
- Example: the San Andreas Fault, where the Pacific Plate moves north-west past the North American Plate.
"CHECK & CORRECT — THE SAN ANDREAS CONTRADICTION" p 10 lists the San Andreas and Alpine faults as examples of continental convergence. p 20 and p 59 classify the San Andreas as a transform boundary. Transform is correct: the Pacific Plate slides north-west past North America. The p 10 line is a slip, confirmed by the p 20 map question (Q5) and the exam-scope note that transform boundaries have no volcanism (p 53). |
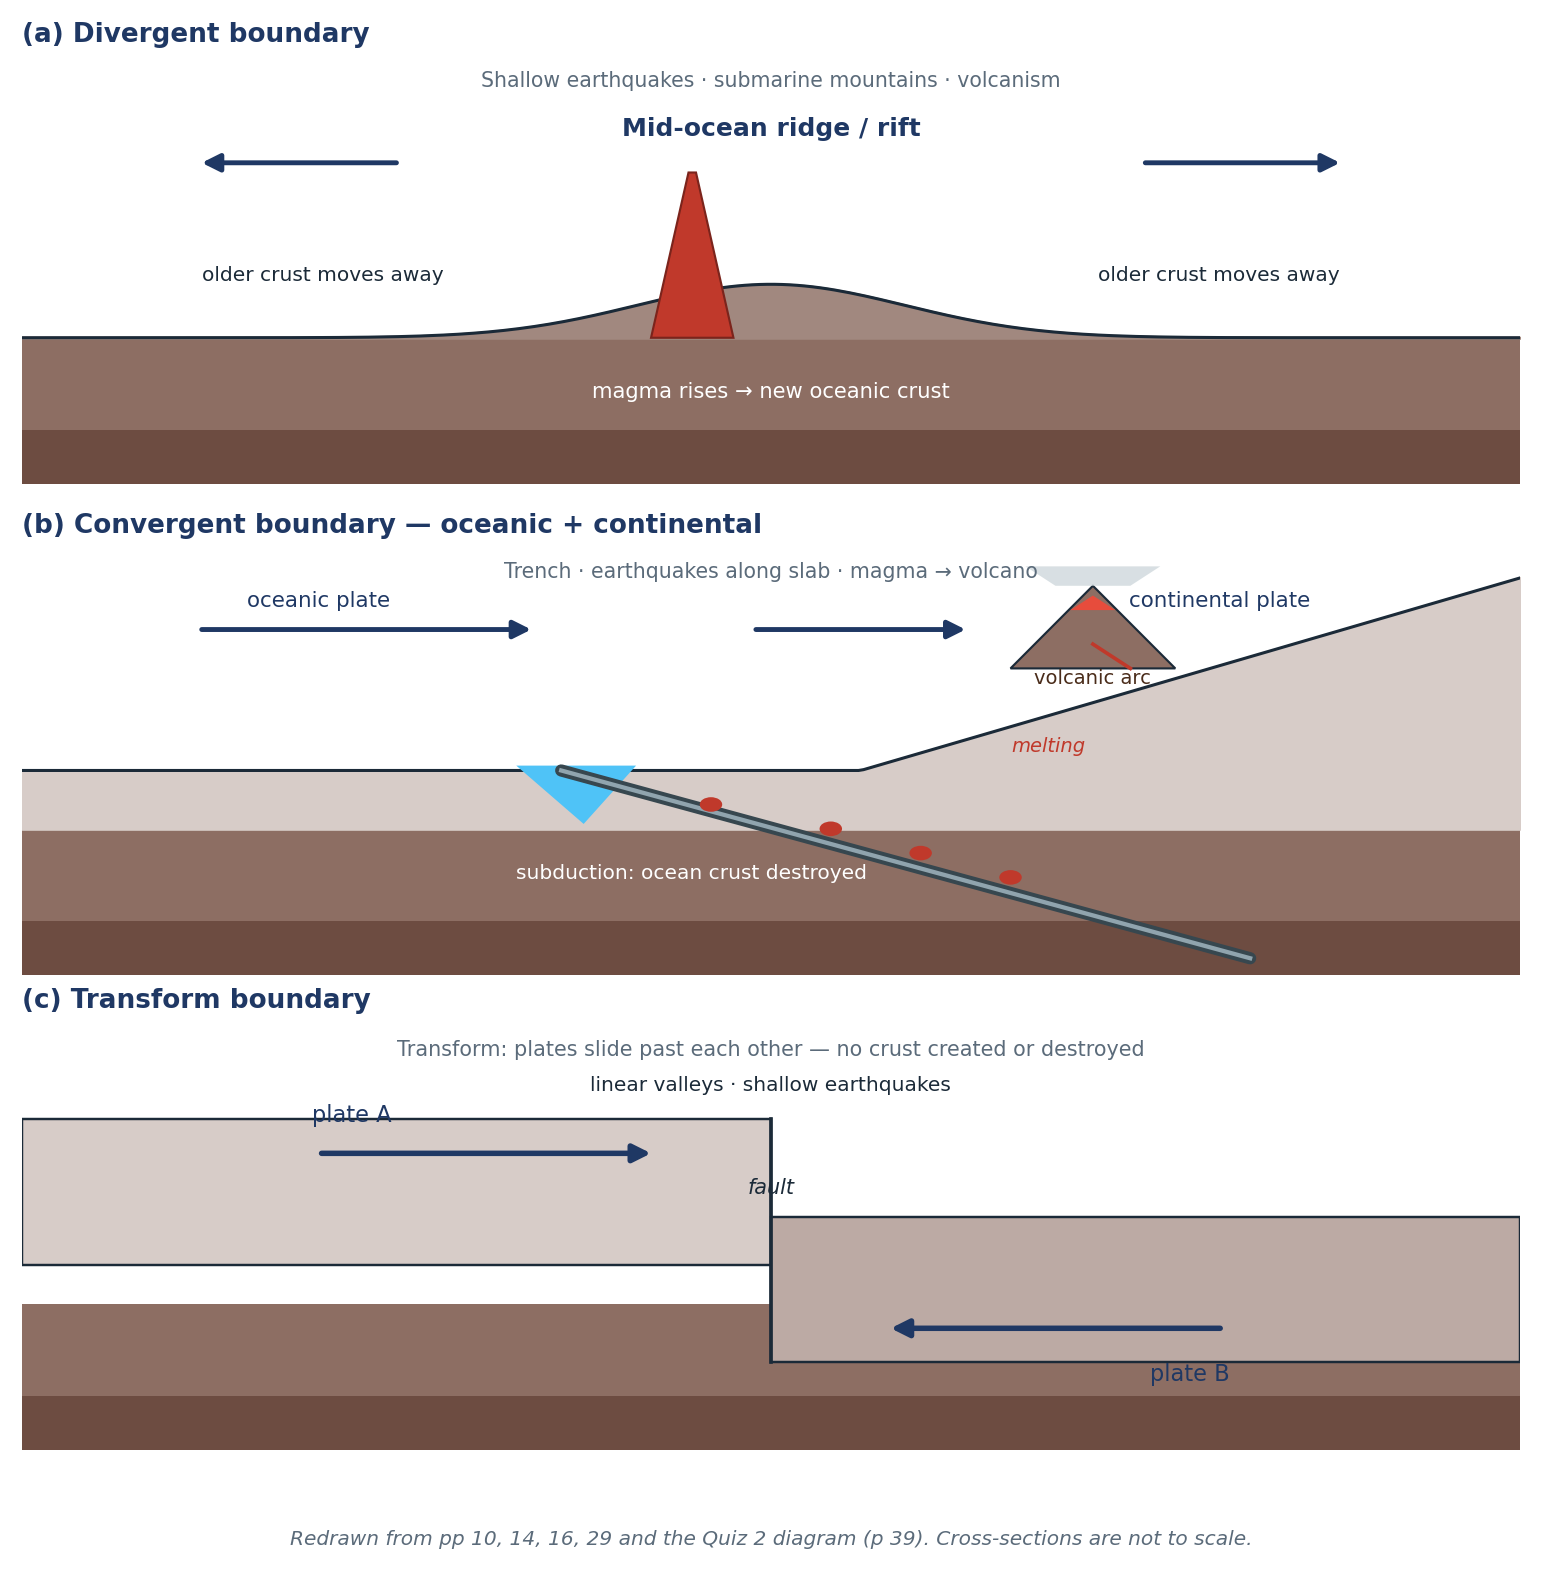
Figure 3.1 The three boundary types in cross-section, with crust creation, destruction and the resulting hazards. Redrawn from pp 10, 14, 16, 29 and 39.
"CHECK & CORRECT — RIDGE MOTION AND 'MELTING' LABELS" The p 14 sketch writes "melting" near the ridge and the p 20 map answers describe the ridge moving "towards" the boundary. At a ridge, plates move away from the axis on both sides, and the rock melts because pressure drops, not because it is heated. At a subduction zone the slab melts because water lowers the melting point of the mantle above it. Say "decompression melting" at ridges and "flux melting" above slabs. |
3.4 Reading a plate map
The world map on p 20 is the model for every plate question. To read it:
1. Identify the plate under the named place (e.g. Florida → North American Plate).
2. Identify the boundary type from the symbols or the arrows.
3. Say which plate is denser — oceanic crust is denser, so it subducts.
4. Name the result: trench, volcanic arc, island arc, fold mountains, rift, or transform valley.
Answers to the p 20 map questions (with corrections):
Q | Place / line | Answer |
1 | Tallahassee, Florida | North American Plate |
2 | Nazca–South America | Convergent; South America overrides (continental) |
3 | Aleutian arc | Subduction of the Pacific Plate |
4 | Indo-Australian–Antarctic | Divergent |
5 | San Andreas | Transform |
6 | South-east Indian Ridge | Divergent |
7 | Africa–South America | Moving apart (divergent) |
8 | Mid-ocean ridge | Plates move away from the ridge |
9 | 30°N, 40°E | Arabian Plate (not African) |
10 | San Andreas relative motion | Pacific moves north-west past North America |
"EXAM TIP — NAME, MOTION, RESULT" Answer plate questions in three steps: name the plates → state the motion → state the landform or hazard. "Nazca and South America converge; the oceanic Nazca plate subducts; this makes the Andes volcanic arc and deep earthquakes" scores three marks where "they collide" scores one. |
3.5 Folding and faulting
Rock behaves differently depending on temperature, pressure and speed of deformation (p 29):
- Ductile rock (deep, hot, or deformed slowly) folds.
- Brittle rock (shallow, cool, or deformed quickly) faults.
Fold types (p 29):
- Anticline — an upward arch; the oldest rock is in the core.
- Syncline — a downward trough; the youngest rock is in the core.
- Symmetrical — both limbs dip equally.
- Asymmetrical — one limb is steeper.
- Overfold — one limb is pushed past vertical.
- Recumbent — the fold lies on its side, limbs nearly horizontal.
- The axis is the line of maximum curvature; the axial plane joins the axes of successive layers.
Fault types (p 29):
- Normal fault — tension pulls the crust apart; the hanging wall drops.
- Reverse fault — compression pushes the crust together; the hanging wall is pushed up and over.
- Strike-slip fault — shear; blocks slide horizontally past each other.
- The hanging wall is the block above the fault plane; the footwall is below it. Dip is the angle of the fault plane; strike is its direction.
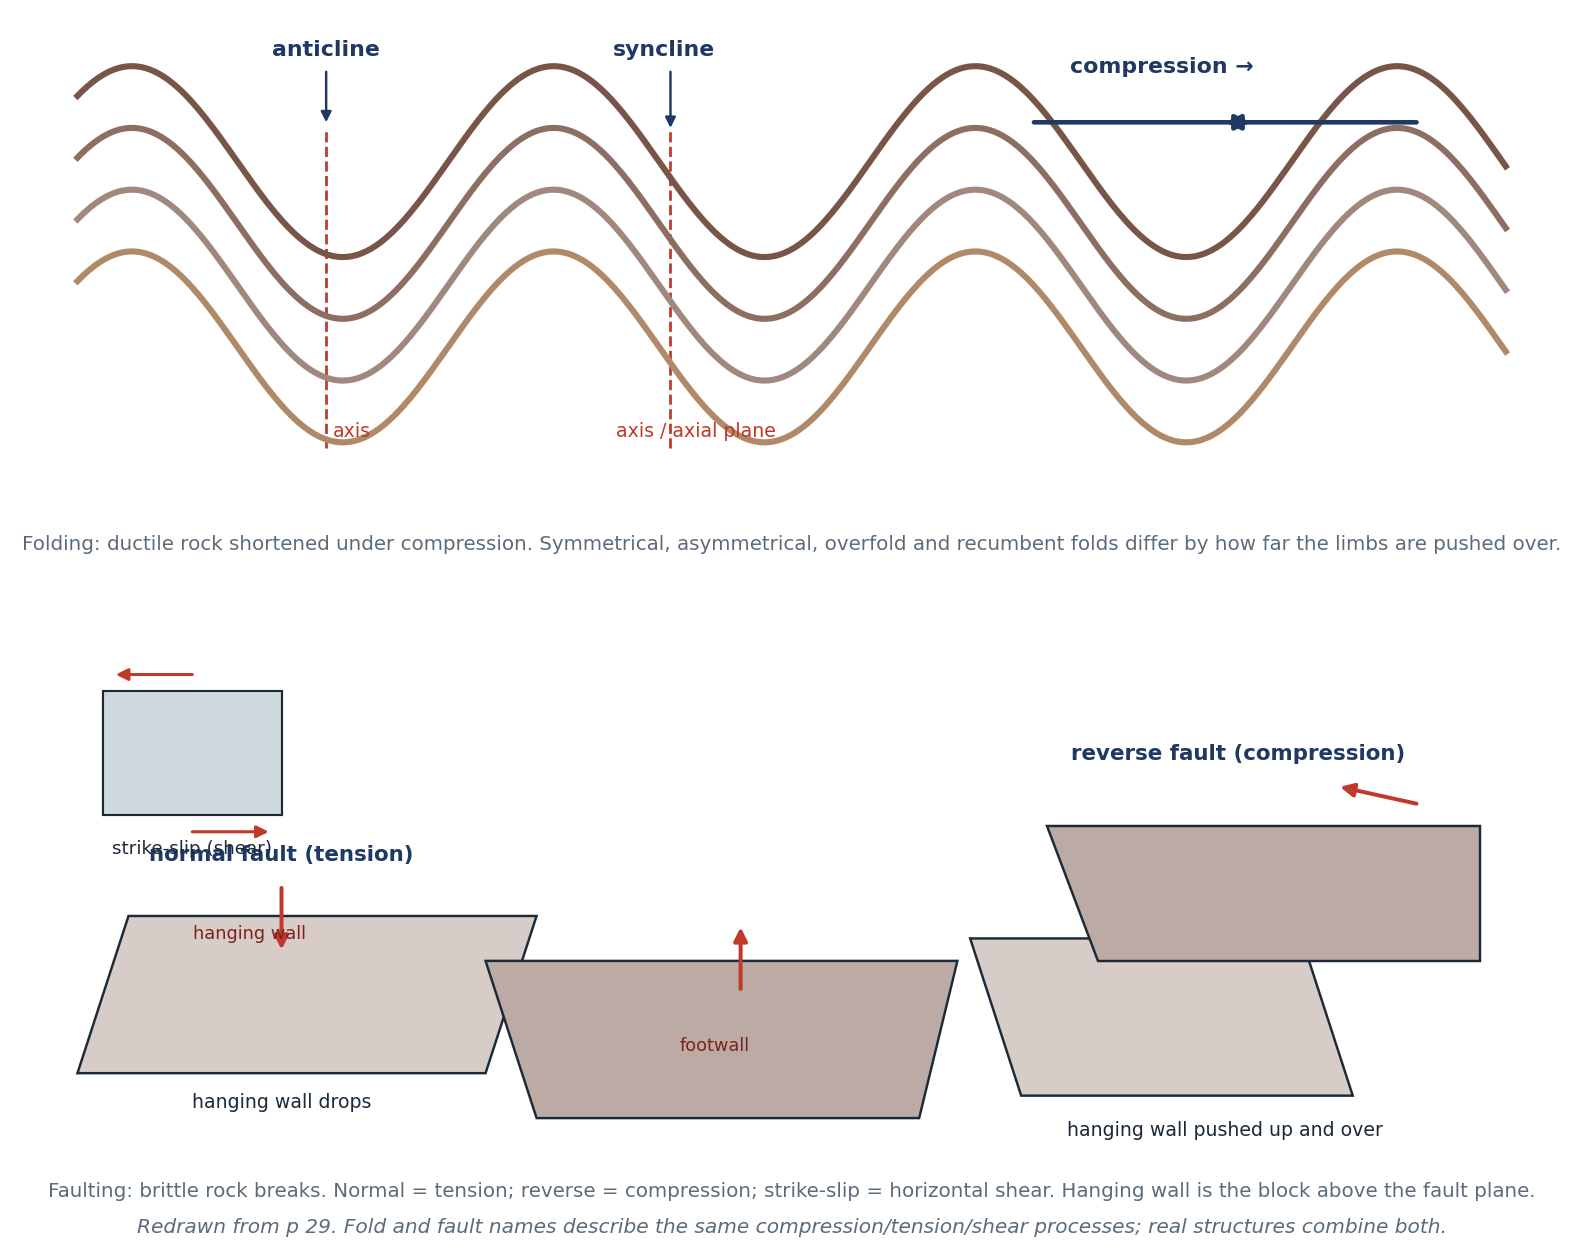
Figure 3.2 Folds and faults: the structures produced by compression, tension and shear. Redrawn from p 29.
"COMPRESSION, TENSION, SHEAR — ONE LINE EACH" Compression → folds and reverse faults (crust shortens and thickens). Tension → normal faults (crust stretches and drops). Shear → strike-slip faults (crust slides sideways). This is exactly the grouping the exam scope asks for (p 53). |
3.6 Worked example — a boundary from a diagram
"EXAMPLE — INTERPRET THE CROSS-SECTION" A cross-section shows an oceanic plate bending downwards under a continental plate, with a trench at the surface, earthquakes along the sloping plate, and a volcano above it. Name the boundary, the process and two hazards. Answer. Convergent boundary, oceanic–continental. The denser oceanic plate subducts beneath the continental plate. The trench marks the subduction zone; earthquakes occur along the descending slab; water released from the slab lowers the melting point of the mantle, magma rises, and a volcanic arc forms. Hazards: earthquakes (including tsunamis if the sea floor is displaced) and volcanic eruptions (ash, pyroclastic flows, lahars). |
3.7 Self-test
1. State Wegener's hypothesis, its date and its missing mechanism.
2. Name four types of evidence he used.
3. Explain sea-floor spreading in three sentences.
4. Compare oceanic and continental divergence, with one example each.
5. Explain why the Andes are volcanic but the Himalayas are not.
6. What happens at an oceanic–oceanic convergent boundary? Name two examples.
7. Why does the San Andreas Fault produce earthquakes but no volcanoes?
8. Distinguish anticline from syncline.
9. Name the fault type produced by tension and the one produced by compression.
10. Define hanging wall and footwall.
11. Why is oceanic crust destroyed at trenches but continental crust is not?
CHAPTER 4
Volcanoes, Earthquakes & Tsunamis
How they form · structure · measurement · hazards and benefits · Mount St Helens
Source pages: pp 37–39, 41, 49, 53, 58–59, 64–65
Volcanoes, earthquakes and tsunamis are the visible evidence that plates move. All three release or transfer energy stored in the crust (p 39) — that single idea links this chapter to plate tectonics.
4.1 How volcanoes form
- Magma forms where rock melts: at subduction zones (water lowers the melting point), at mid-ocean ridges (pressure drops), and at hot spots (a plume of hot mantle).
- Magma is less dense than the surrounding rock, so it rises through fractures, collects in magma chambers, and reaches the surface through a vent as lava, ash and gas (p 59).
- A volcano is therefore a vent system, not just a mountain: the mountain is built by layers of lava and ash around the vent.
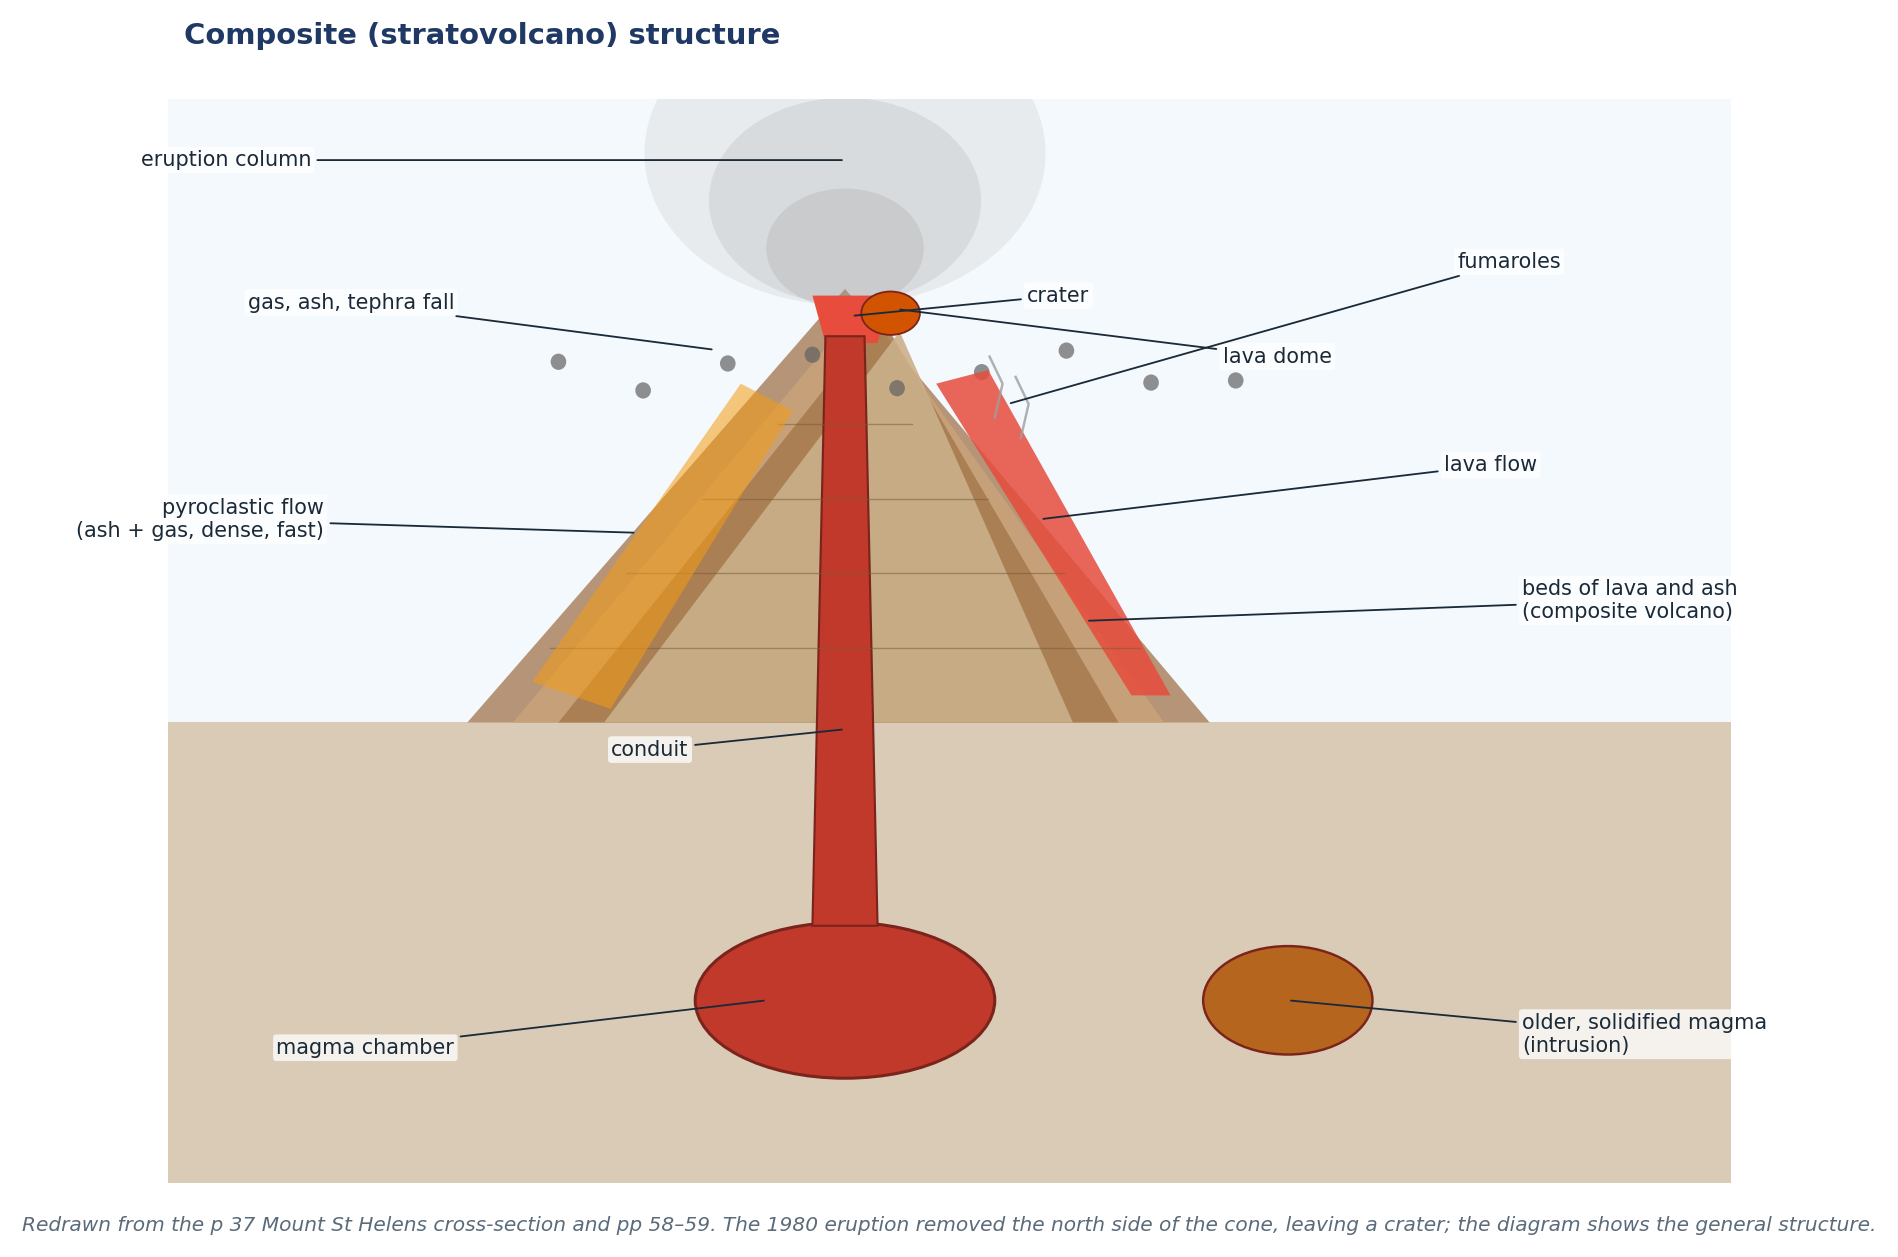
Figure 4.1 Structure of a composite volcano, with the full label set from p 37 (eruption column, ash fall, lava dome, lava flow, pyroclastic flow, fumaroles, conduit, magma chamber).
4.2 Volcano types and status (p 58)
Type | Shape | Materials | Eruption style |
Cinder cone | Small, steep, narrow base | Ash, cinders, bombs | Short, explosive bursts |
Composite (stratovolcano) | Large, steep, layered | Alternating lava and ash | Explosive, dangerous; Mt St Helens, Fuji |
Shield | Broad, gentle slopes | Runny lava | Frequent, gentle flows; Hawaii |
- Active — has erupted in historical time or shows signs of unrest.
- Dormant — not currently erupting but not extinct; may erupt again.
- Extinct — no longer able to erupt.
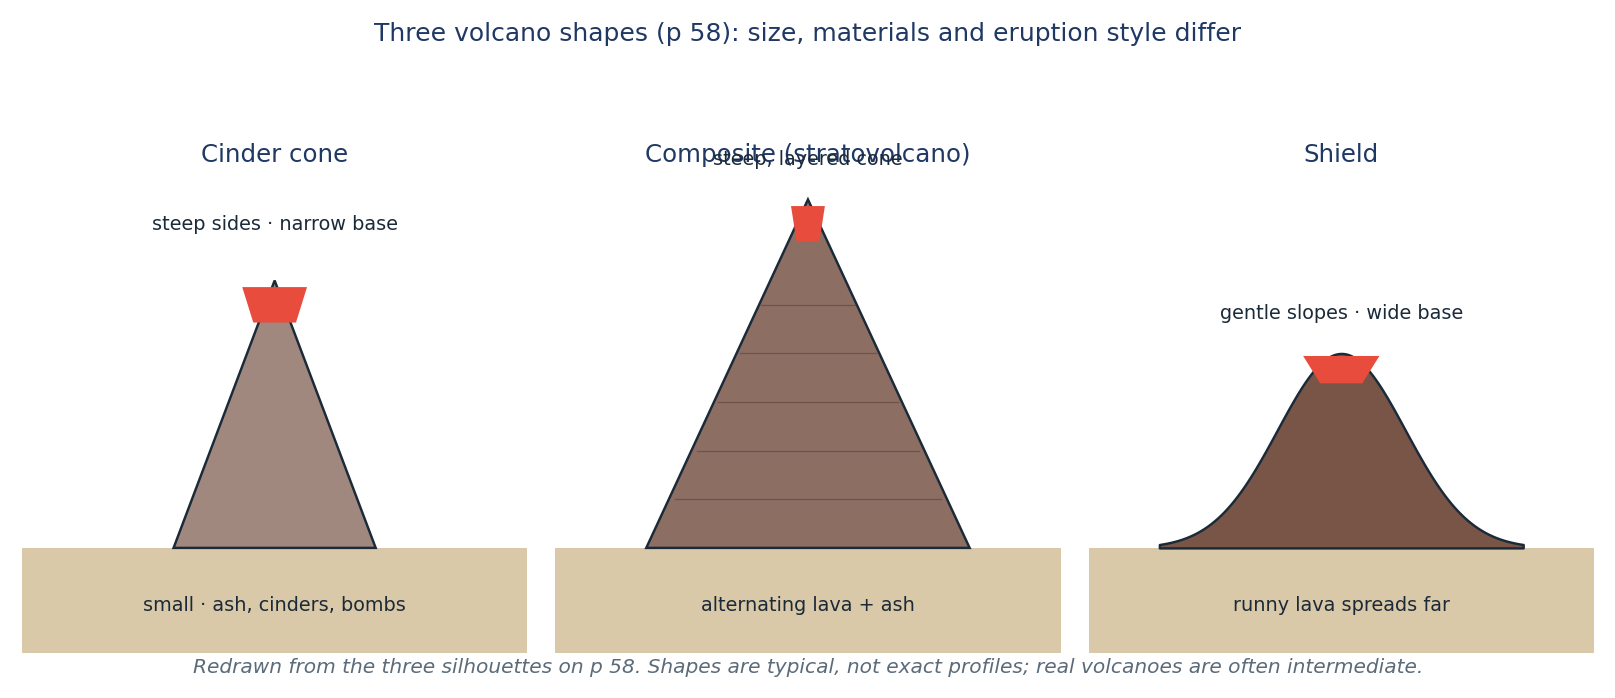
Figure 4.2 The three volcano shapes compared. Redrawn from the silhouettes on p 58.
4.3 Earthquakes
- An earthquake is the sudden release of energy when rock breaks or slips along a fault (p 59).
- Focus (hypocentre) — the point inside the Earth where the rock breaks.
- Epicentre — the point on the surface directly above the focus.
- Seismic waves radiate from the focus: P waves (fast, push–pull), S waves (slower, side-to-side) and surface waves (slowest, most damaging).
- Seismograph records the waves as a trace; the Richter magnitude measures the energy released (one number per earthquake), while the Mercalli scale measures observed effects at a particular place, so it varies with distance and ground conditions (p 58).
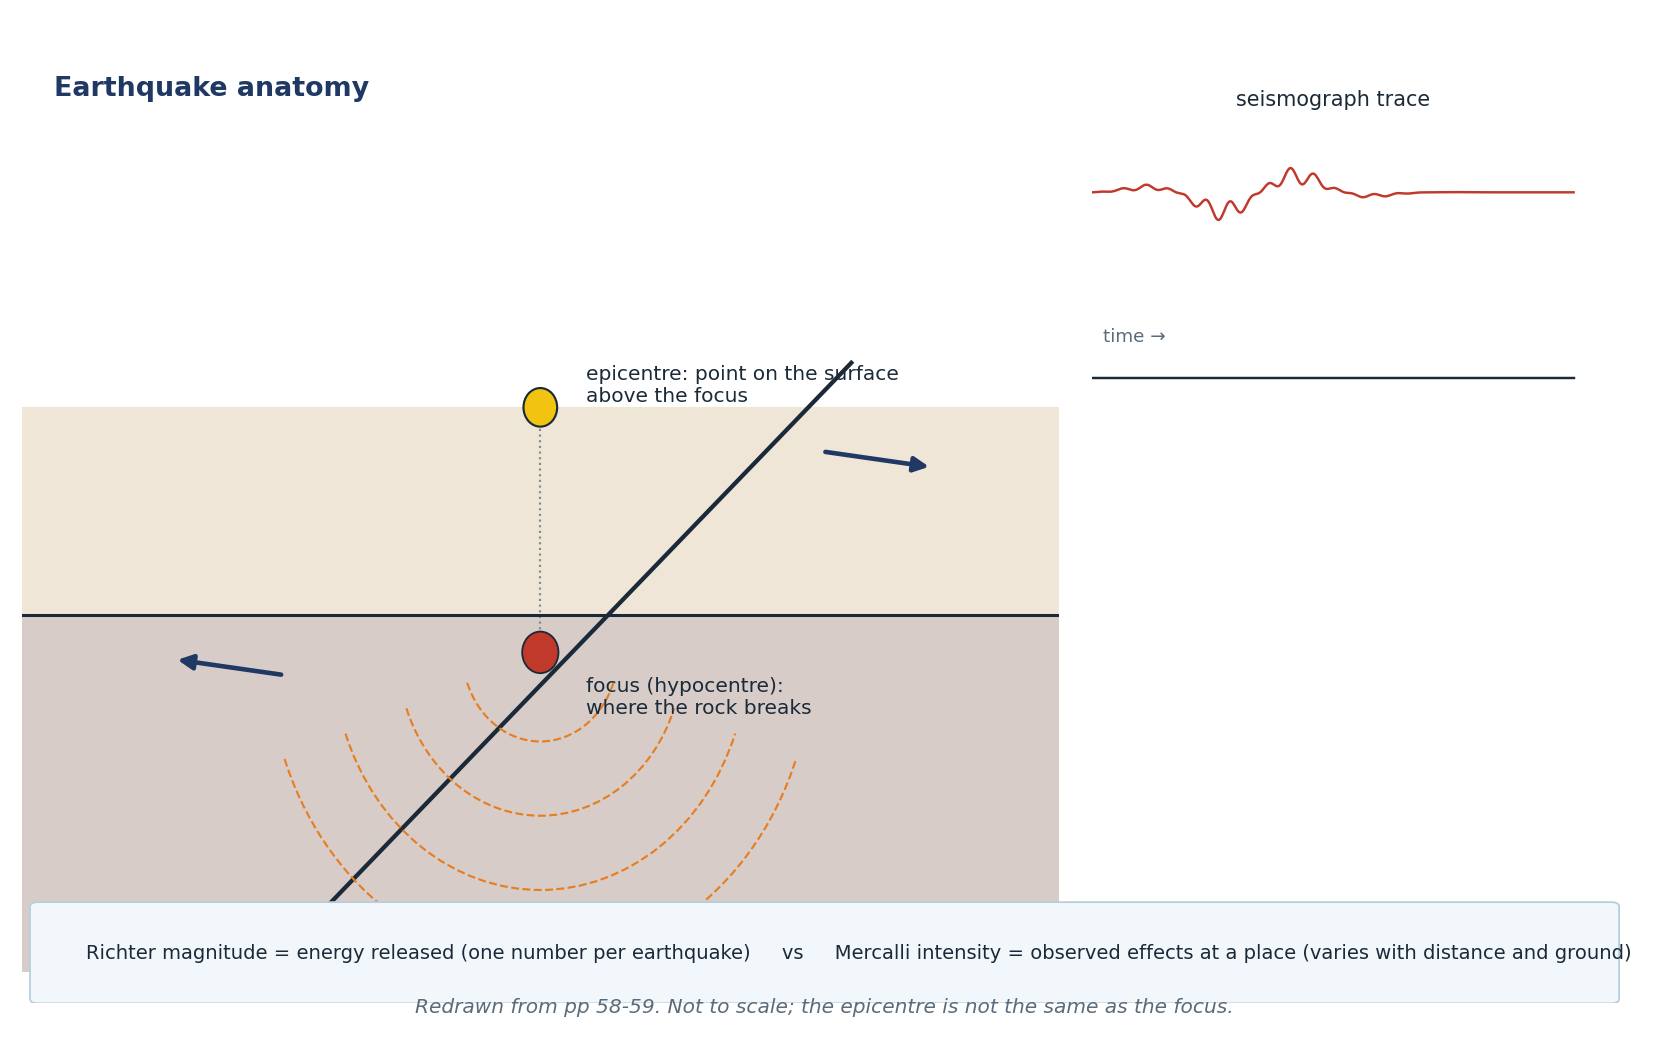
Figure 4.3 Focus, epicentre, seismic waves and a seismograph trace. Redrawn from pp 58–59.
4.4 Tsunamis
- A tsunami is a series of waves caused by the displacement of a whole water column — usually by an undersea earthquake, landslide or volcanic eruption (p 58).
- In deep water the wave has a long wavelength, travels very fast (up to ~800 km/h) and is low; ships may not notice it.
- Near the shore it slows, shortens and rises; the water can run inland and then drain back with great force.
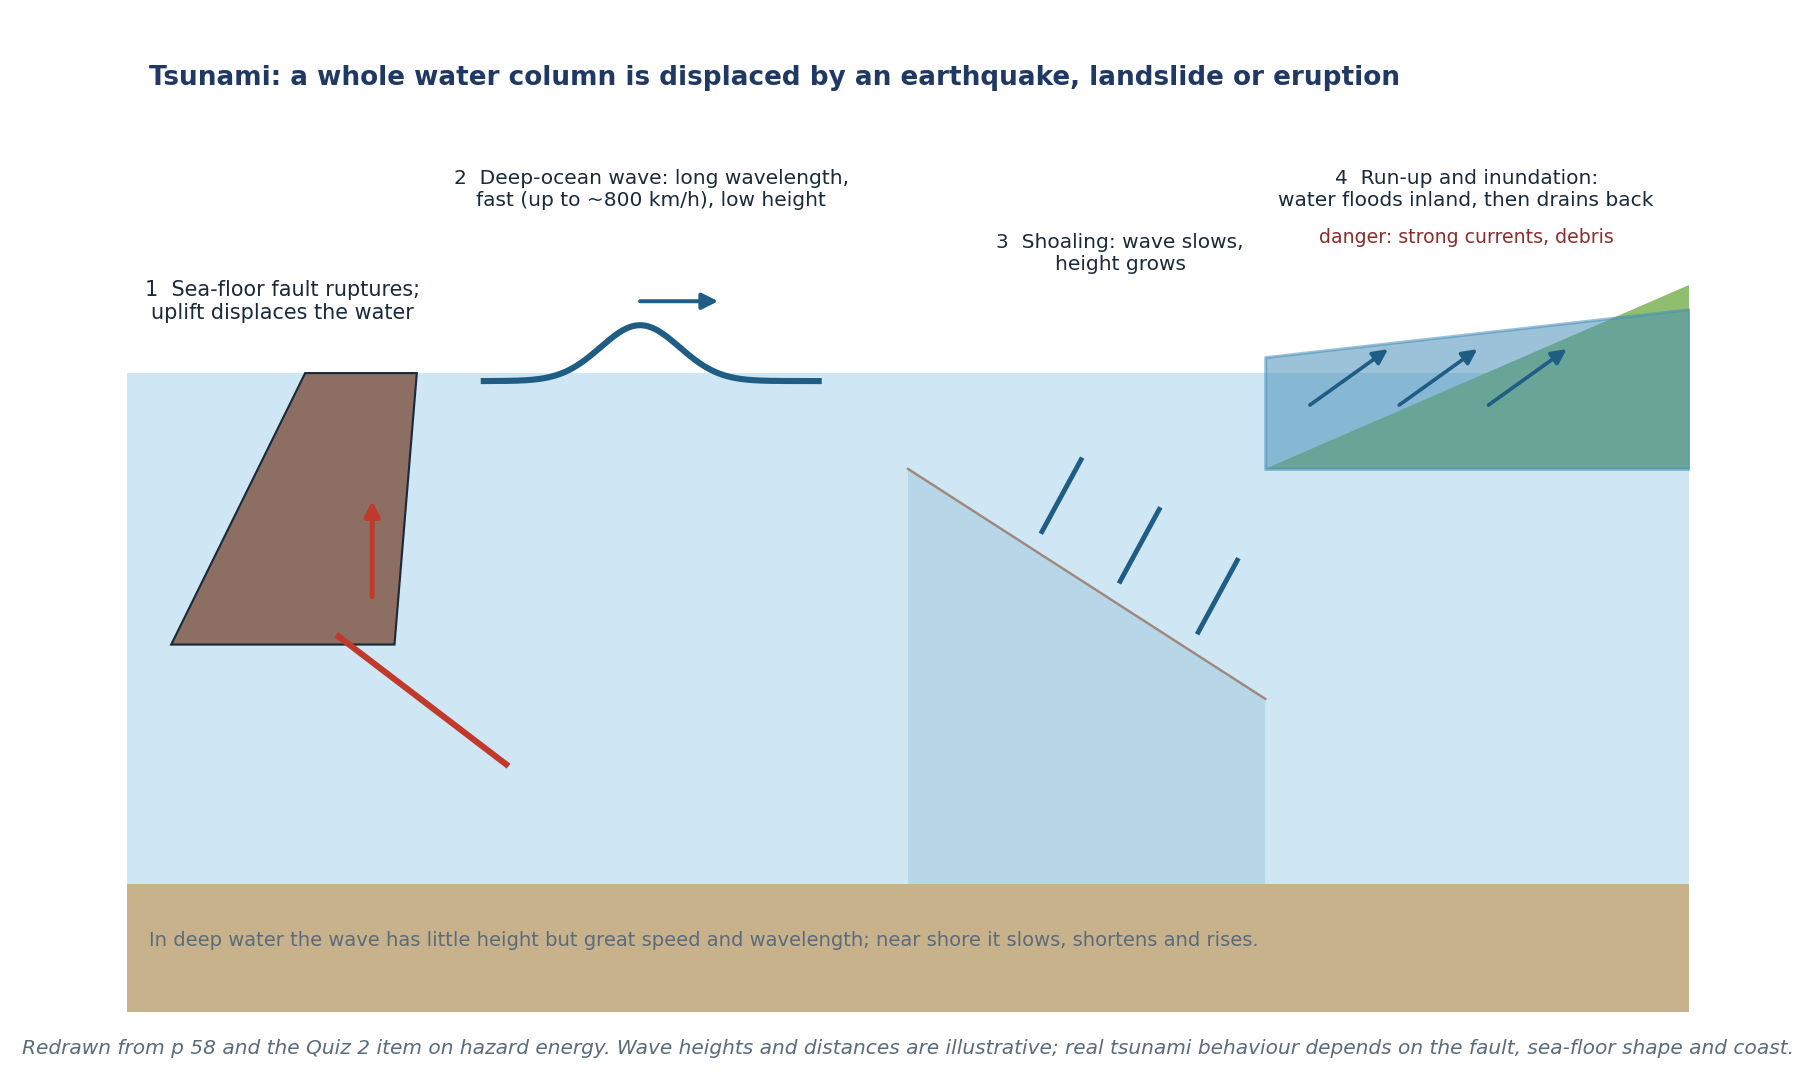
Figure 4.4 The four stages of a tsunami, from fault rupture to run-up. Redrawn from p 58.
"CHECK & CORRECT — TSUNAMI WORDING (P 58)" The packet says the wave is "blocked at shore" and "generated by the epicentre". Neither is precise. A tsunami is shoaled (slowed and steepened) by shallow water, not blocked, and it is generated by displacement of the sea floor, which may be far from the epicentre. The epicentre is a point on the surface; the water is displaced by the fault movement below it. |
4.5 Benefits and risks of living near volcanoes (pp 41, 64)
Benefits | Risks |
Fertile volcanic soils (weathered lava and ash) | Pyroclastic flows — fast, hot ash and gas |
Geothermal energy and hot springs | Lava flows |
Tourism and jobs | Ash fall: roofs collapse, crops damaged, air travel disrupted |
Minerals and building materials | Lahars — volcanic mudflows that can travel far down valleys |
Rainfall and moisture on high ground | Gases (CO₂, SO₂) — health hazard |
Scientific study and monitoring | Tsunamis and landslides triggered by eruptions |
Examples from p 41 and p 64: El Misti (metals), Kilauea and Etna (tourism), Tambora (1815 deaths), tropical rainfall triggering lahars. Historical death tolls must be given with their source and date — do not update them silently.
"JUDGEMENT QUESTIONS" A "should people live near volcanoes?" answer must weigh both sides and decide, not just list. Use: benefit → risk → management (monitoring, evacuation, land-use planning) → judgement. The student answer on p 41 prioritised lives; that is a defensible judgement, not the only correct one. |
4.6 Mount St Helens — the five themes (pp 37–38, 49)
Location. 46°N, 122°W, in Washington State, USA; south of Seattle, north of the Columbia River; in the Cascades (p 38).
Place. A composite volcano; the 1980 eruption removed its north side, leaving a huge crater. It is part of the Cascades Volcanic Arc, a formal region of volcanoes above the subducting Juan de Fuca Plate (p 37).
Region. The Cascades run from northern California through Oregon and Washington into British Columbia; the arc is caused by oceanic–continental convergence (p 38).
Movement. The ash plume moved east with prevailing winds; people moved temporarily (evacuation) and some permanently; scientists and hazard-management knowledge spread worldwide; transport was disrupted; sediment from lahars moved down rivers for years (p 49).
HEI. The eruption modified the landscape (crater, blown-down forest, ash layer), affected people (57 deaths, homes, roads, logging), and led to management (monitoring, evacuation zones, river dredging).
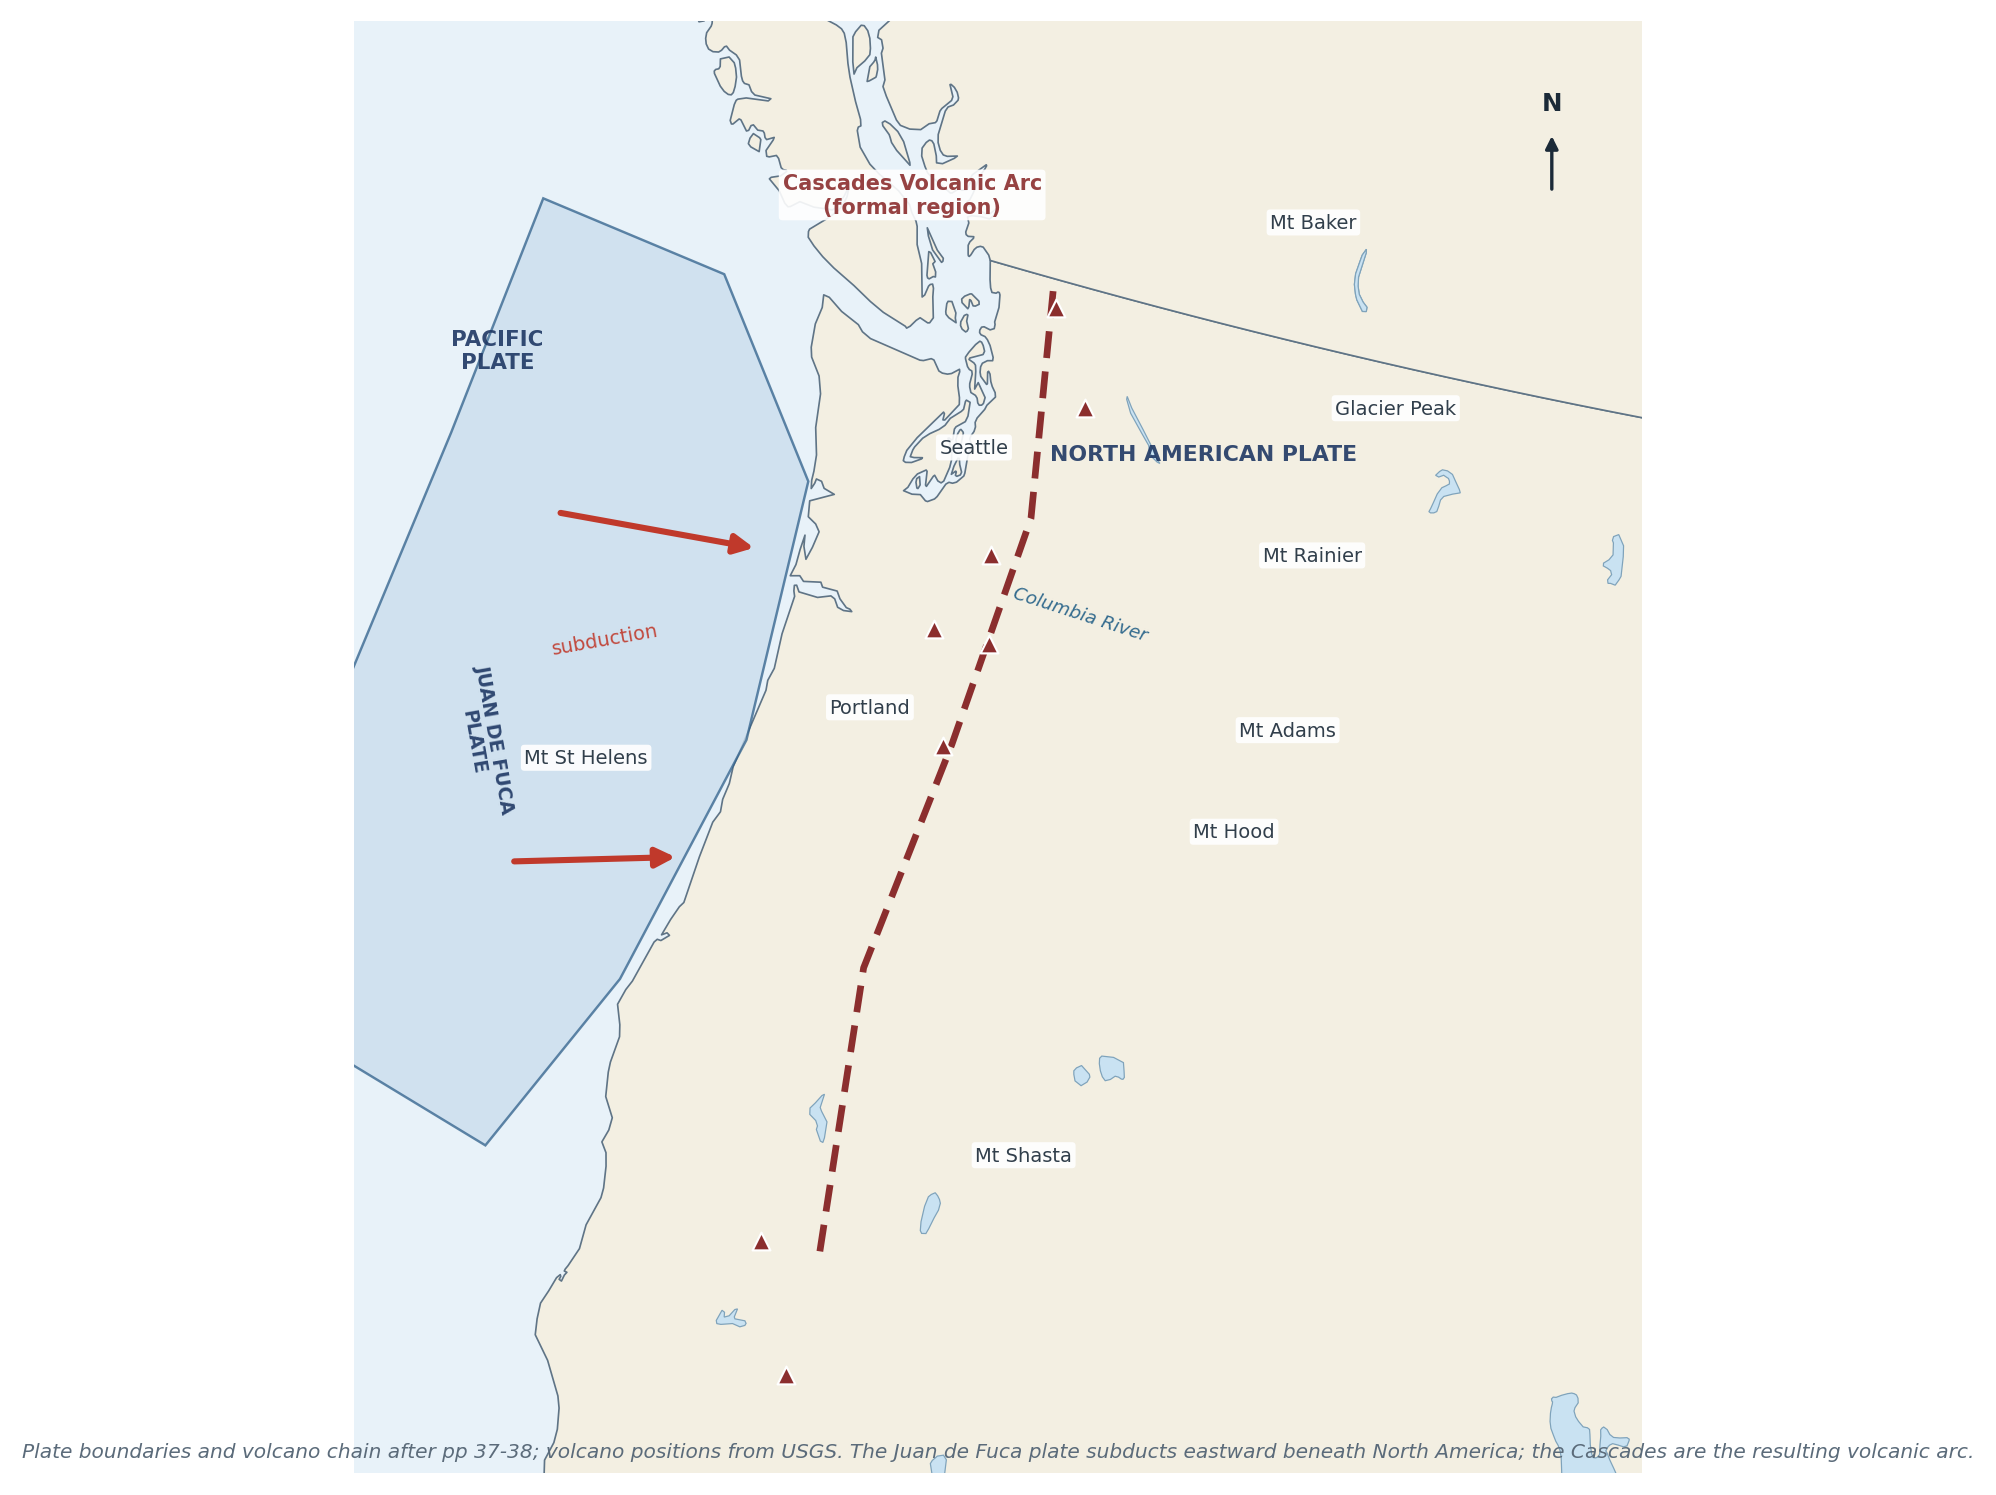
Figure 4.5 The Cascades volcanic arc and the Juan de Fuca subduction zone. Base map: Natural Earth; volcano locations after USGS and pp 37–38.
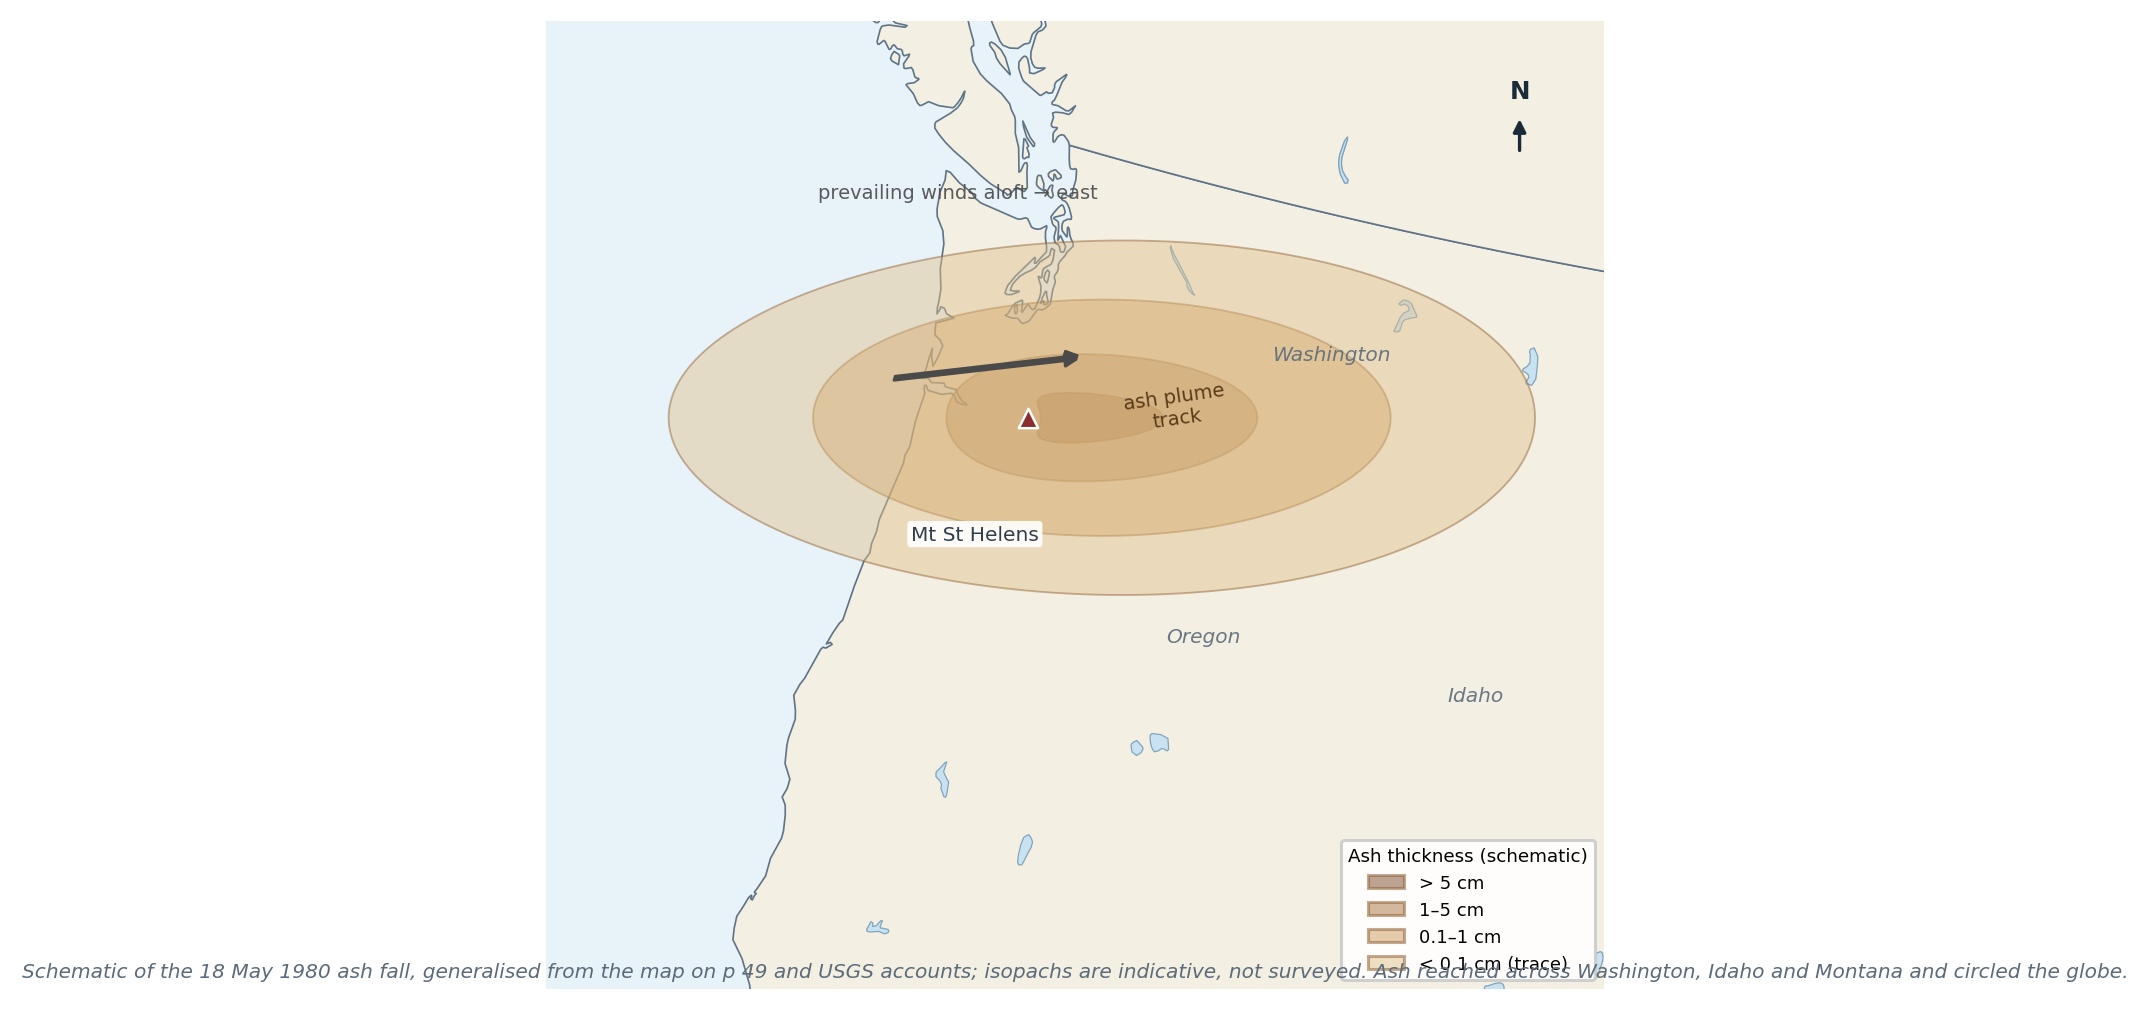
Figure 4.6 The 18 May 1980 ash fall (schematic). Redrawn and generalised from p 49 and USGS accounts.
"CHECK & CORRECT — THE VOLCANO AND THE PLATE" The p 38 answer says Mt St Helens is "on the convergent plate Juan de Fuca". The volcano sits on the North American Plate; the Juan de Fuca Plate is subducting beneath it. Say it that way. |
4.7 Worked example
"EXAMPLE — EXPLAIN THE HAZARD CHAIN" Explain why a subduction-zone volcano can produce a lahar. Answer. Subduction produces explosive eruptions (thick, gas-rich magma) that deposit loose ash and pyroclastic material on steep slopes. Rain, snowmelt or a crater lake can mix with this material to form a lahar — a fast, dense mudflow that follows valleys, burying and destroying everything in its path. The hazard therefore continues long after the eruption, especially in wet climates (p 41). |
4.8 Self-test
1. Name the three ways magma can form.
2. Label a composite volcano: conduit, vent, crater, magma chamber, ash fall, pyroclastic flow.
3. Compare cinder, composite and shield volcanoes.
4. Distinguish focus and epicentre.
5. Distinguish Richter magnitude from Mercalli intensity.
6. Explain how a tsunami forms and why it is dangerous at the coast.
7. Give three benefits and three risks of living near a volcano.
8. Describe Mount St Helens using all five themes.
9. Why does the Cascades arc exist?
10. Explain why transform boundaries have earthquakes but no volcanoes.
CHAPTER 5
Rocks, Weathering, Erosion & Soils
The rock cycle · three rock types · weathering processes · erosion agents · soil formation and loss
Source pages: pp 6–7, 12, 17–19, 30, 32, 39, 53–54
Rocks are recycled. Weathering breaks them, erosion carries the pieces away, deposition builds new layers, heat and pressure change them, and melting turns them back into magma. Soil is the thin, fragile product of that same system — which is why soil loss is a geography problem, not just a farming problem.
5.1 The rock cycle
The class diagram (pp 17, 39) is a landscape, not a set of boxes: a volcano feeds lava onto the surface, a mountain is uplifted and weathered, a river carries sediment to the sea, layers are buried and compacted, heat and pressure change them, and melting returns rock to magma.
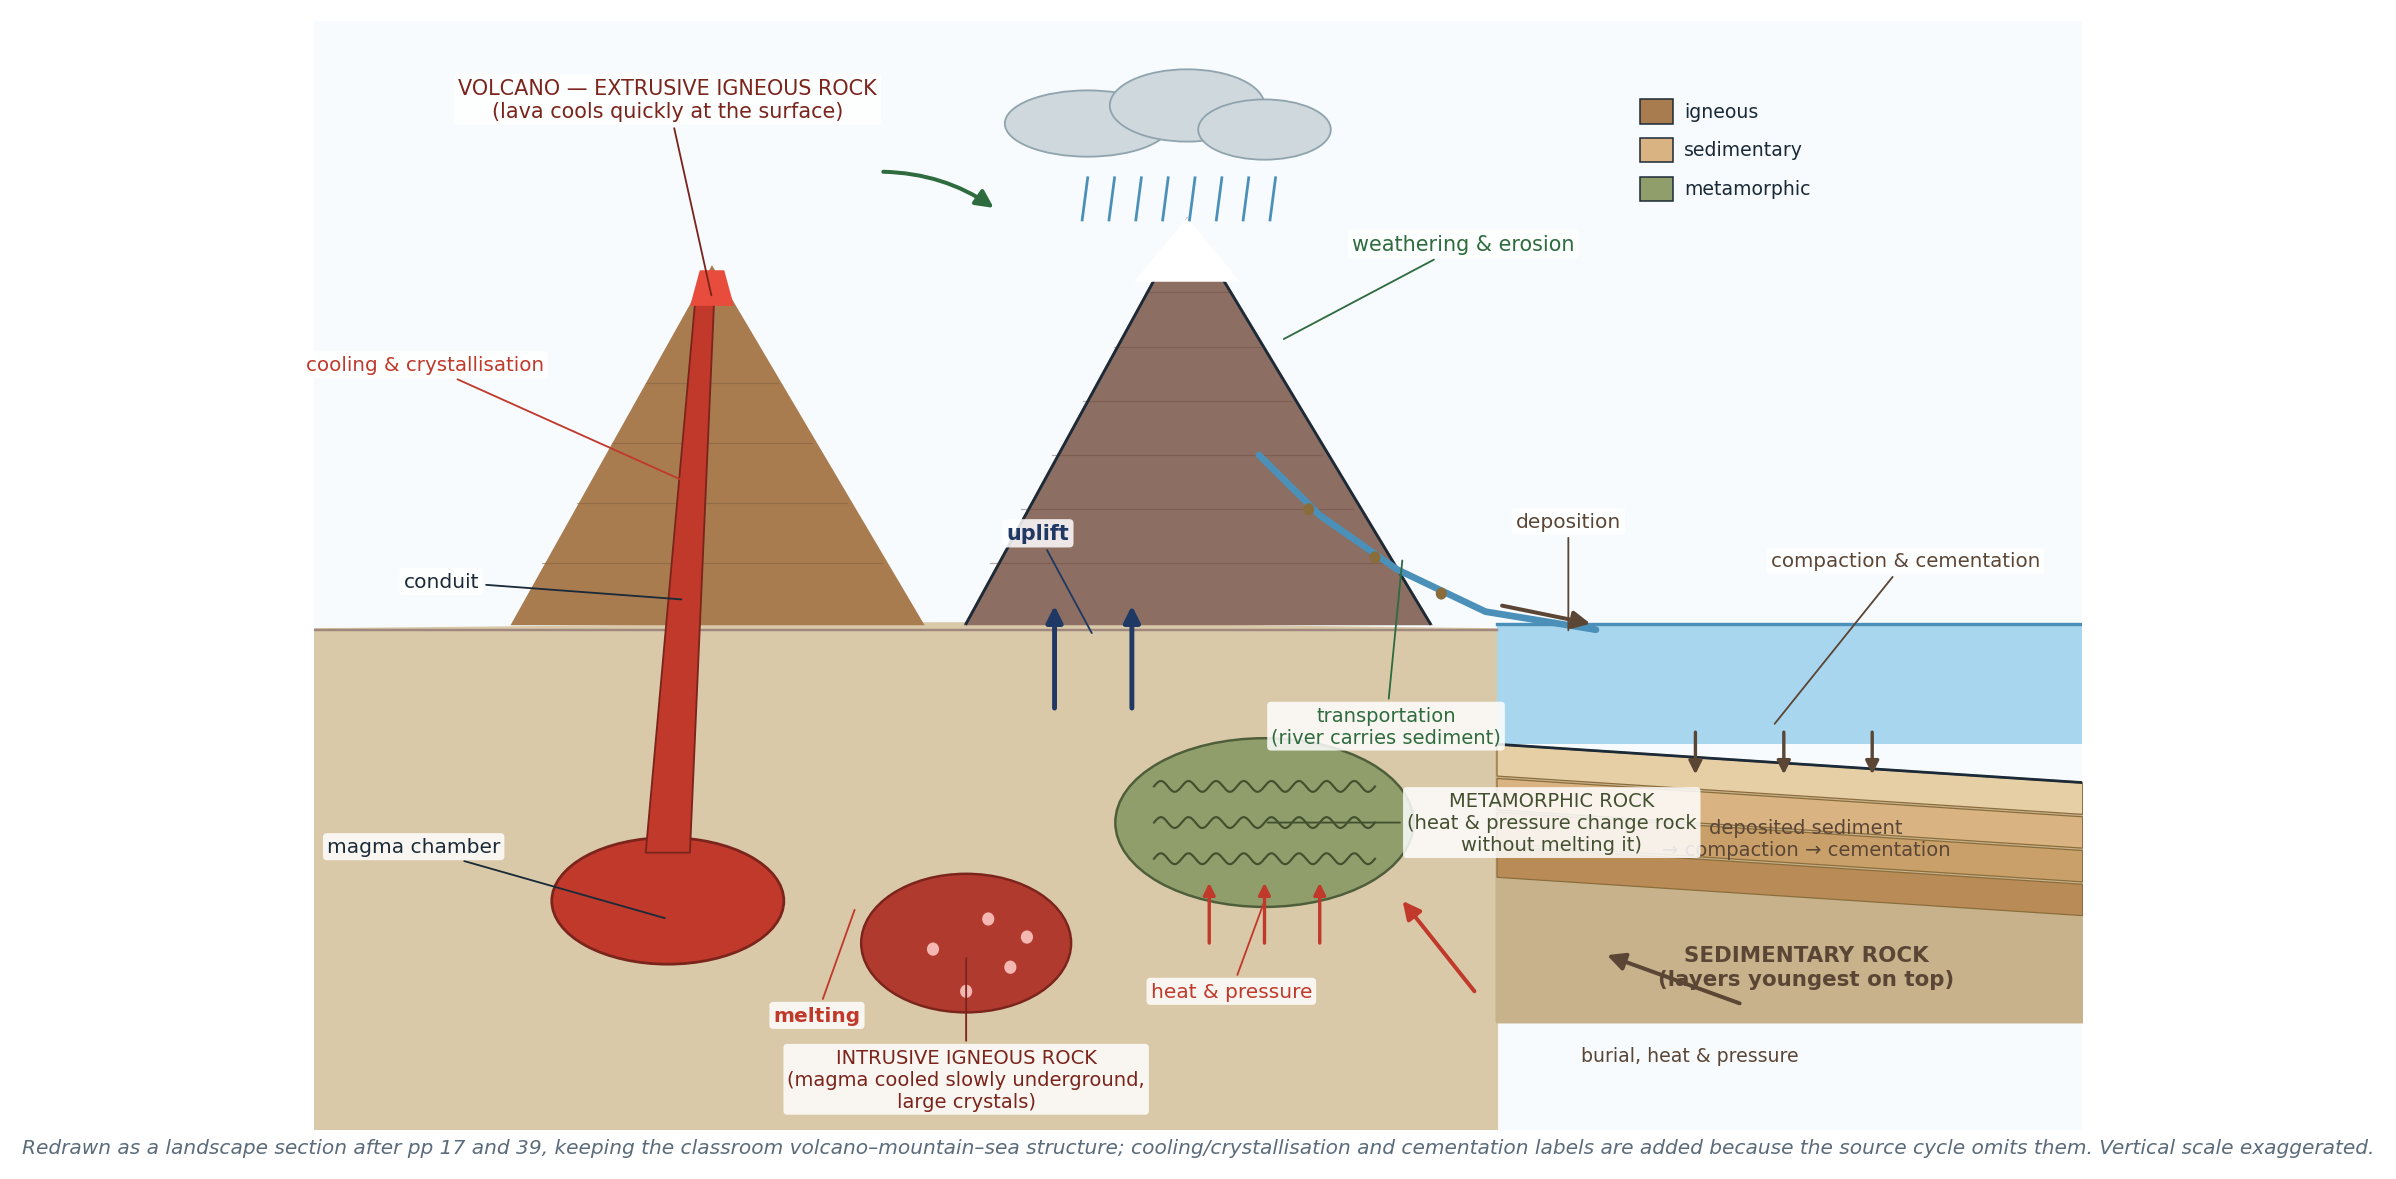
Figure 5.1 The rock cycle as a landscape cross-section, redrawn from pp 17 and 39 with the full mechanism labels.
The processes you must name:
- Melting → magma.
- Cooling and crystallisation → igneous rock (intrusive if it cools underground, extrusive if it cools at the surface).
- Weathering and erosion → sediment.
- Transportation → sediment carried by water, wind or ice.
- Deposition → sediment laid down, usually under water.
- Compaction and cementation → sedimentary rock.
- Heat and pressure (metamorphism) → metamorphic rock, without melting.
- Uplift → rock exposed at the surface again.
5.2 The three rock types (p 18)
Type | How it forms | Crystal size | Examples |
Igneous — intrusive | Magma cools slowly underground | Large crystals, coarse | Granite, gabbro |
Igneous — extrusive | Lava cools quickly at the surface | Small crystals, fine; may be glassy | Basalt, obsidian |
Sedimentary | Sediment deposited, compacted and cemented | Variable; often layered; may contain fossils | Sandstone, shale, chalk, banded iron |
Metamorphic | Existing rock changed by heat and pressure | Often foliated (banded) | Marble (from limestone), slate (from shale), gneiss, jadeite |
- Contact metamorphism happens where magma intrudes and bakes the surrounding rock.
- Regional metamorphism happens over large areas during mountain building.
- Sedimentary rocks are the only ones that can contain fossils, because they form at the surface at low temperature.
"CHECK & CORRECT — JADEITE IS A MINERAL" The p 18 list mixes rocks and minerals: jadeite is a mineral, not a rock type. Use it as an example of a metamorphic mineral, or replace it with a rock such as schist. |
5.3 Weathering
Weathering is the breakdown of rock in place. Erosion is the transport of the broken material (p 19). They are different processes and are often confused in exam answers.
Physical weathering (p 32)
- Freeze–thaw: water enters cracks; at night below 0 °C it freezes and expands by about 9%; the crack widens; repetition breaks the rock (p 17).
- Heating and cooling (thermal expansion / exfoliation): rock minerals expand in the day and contract at night; repeated stress makes outer layers peel off in sheets.
- Salt crystallisation: salt spray lands on rock, water evaporates, salt crystals grow and push the walls of cracks apart — common on dry coasts and in deserts.
- Biological weathering: roots widen cracks; burrowing animals mix the soil; lichens and mosses chemically attack rock.
Chemical weathering (p 32)
- Carbonation: CO₂ dissolves in rainwater to form weak carbonic acid; this reacts with calcite in limestone, forming soluble calcium hydrogencarbonate that is carried away. It widens joints and makes caves.
- Oxidation: iron minerals react with oxygen and rust, weakening the rock (e.g. red sandstone).
- Hydrolysis: feldspar in granite reacts with water and turns to clay.
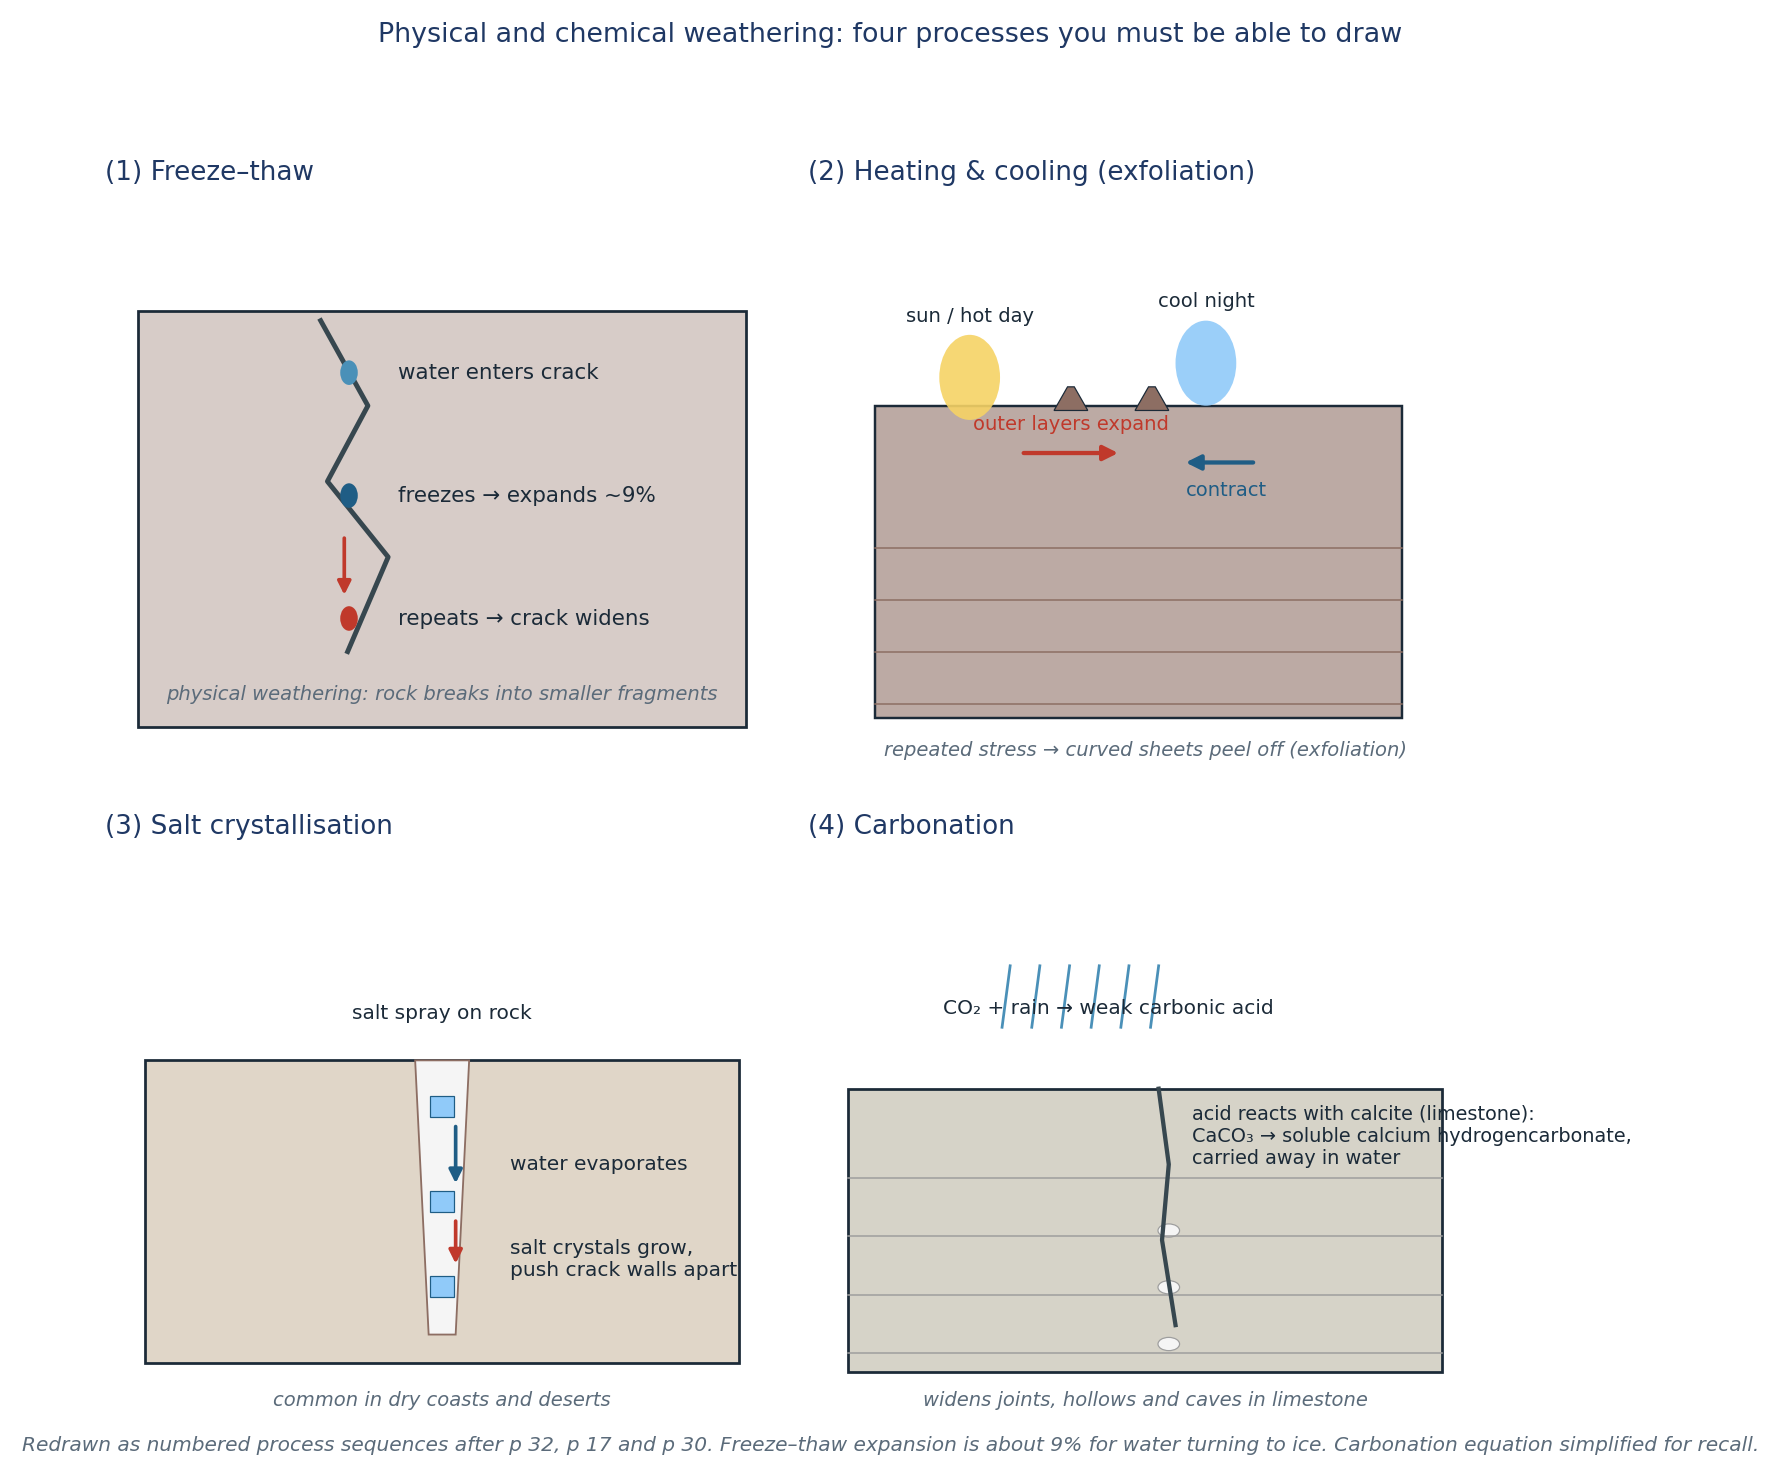
Figure 5.2 Four weathering processes drawn as numbered sequences: freeze–thaw, thermal exfoliation, salt crystallisation and carbonation. Redrawn from pp 17, 30 and 32.
"CHECK & CORRECT — A CLIMATIC RULE OF THUMB" The p 39 quiz answer links hot, dry climates to heating and cooling. That is right for the Atacama, but do not turn it into "hot = thermal, cold = freeze–thaw". Chemical weathering is fastest in hot and wet climates; freeze–thaw needs repeated freezing and thawing (high mountains, cold winters); salt weathering needs salt and evaporation. Match the process to the conditions, not to a single temperature word. |
5.4 Erosion: agents and processes
Agents of erosion (p 30): water (rivers and rain), wind, glaciers, gravity.
River processes (p 30):
- Hydraulic action — the force of water prising rock apart.
- Abrasion — sediment scraping the bed and banks.
- Attrition — stones wearing each other down.
- Corrosion (solution) — water dissolving rock.
Wind — deflation (removing loose particles), abrasion (sandblasting) and attrition.
Glaciers — plucking (freezing onto rock and pulling it away) and abrasion (rock carried in the ice grinding the bed).
Gravity — rockfalls, landslides and creep move material downslope without a transporting medium.
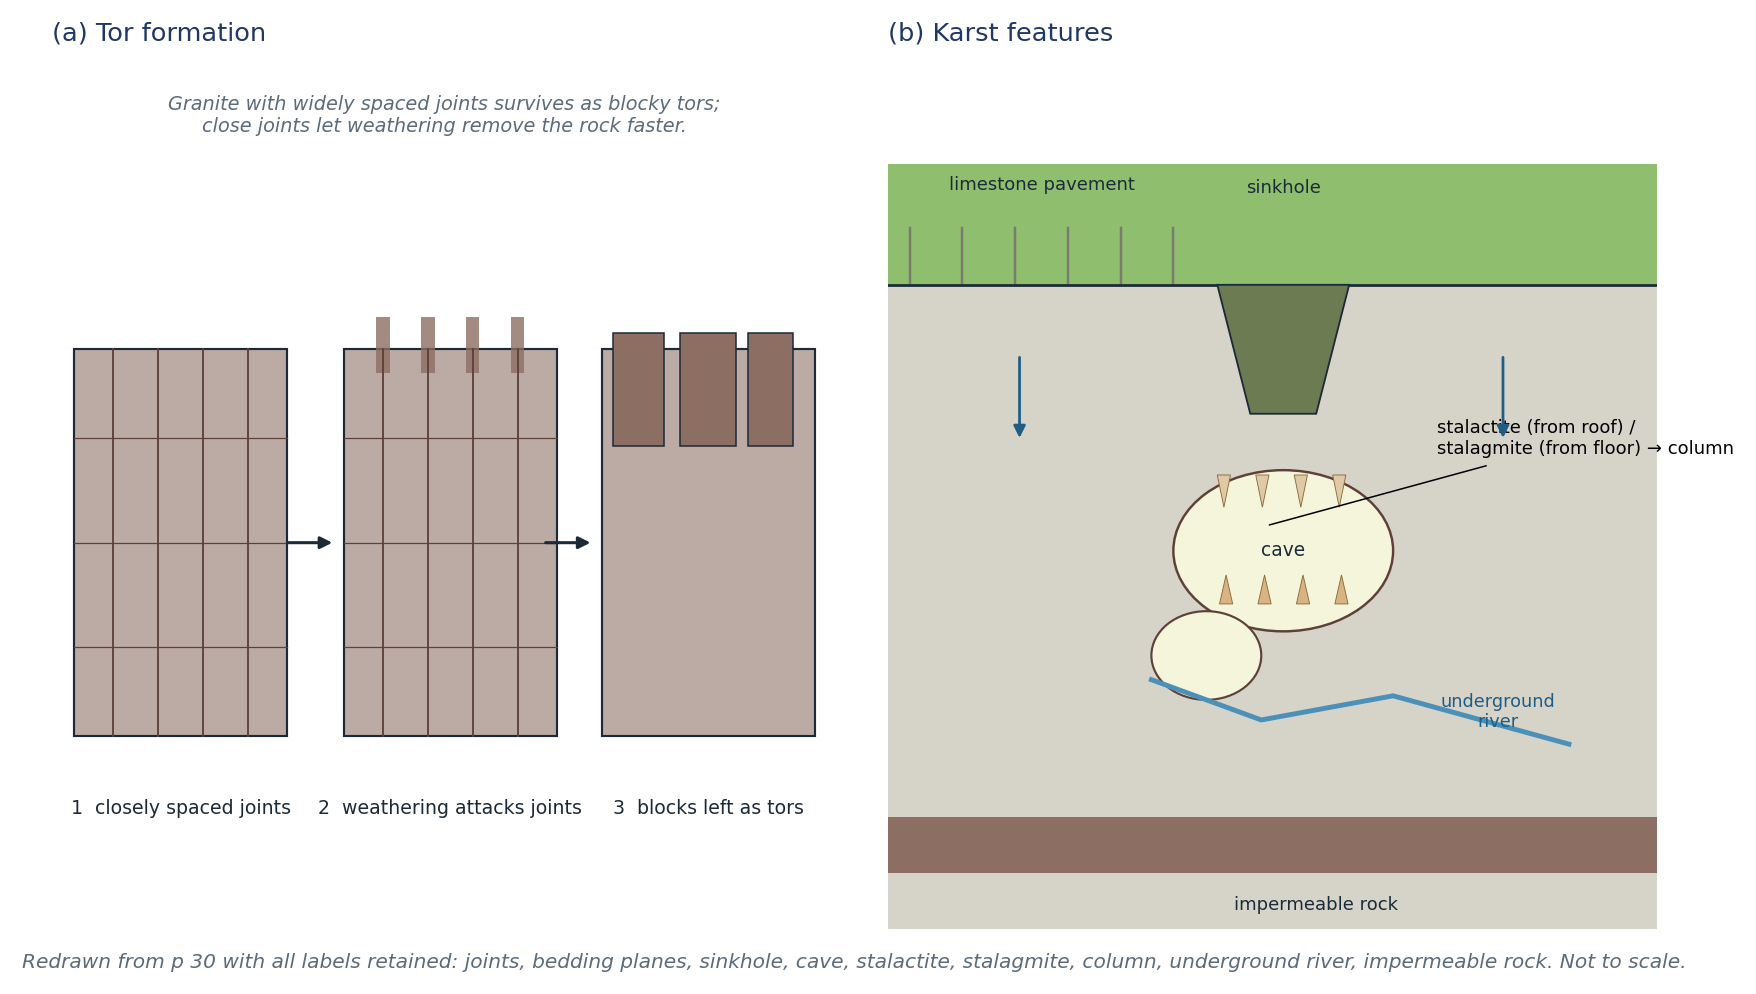
Figure 5.3 Tor formation and karst features, with all labels from p 30.
Tor formation (p 30): granite with closely spaced joints weathers quickly along the joints; where joints are widely spaced, blocks survive as tors — isolated blocky outcrops.
Karst (p 30): limestone is dissolved by carbonation along joints and bedding planes, producing limestone pavement, sinkholes, caves, stalactites (from the roof), stalagmites (from the floor), columns (where they meet), underground rivers and impermeable rock beneath.
5.5 Soils
What soil is (pp 6, 12): a mixture of minerals (weathered rock), organic matter (litter, humus, living biomass), water and air. Soil supports plants and animals, stores water and carbon, and is the base of agriculture.
The organic chain: litter (dead leaves and twigs) → humus (dark decomposed matter) → mineralisation by decomposers, releasing nitrogen, phosphorus and sulphur for plants. Biomass is the living part (roots, soil organisms).
Leaching (pp 6, 7, 12): water moves downwards through the soil carrying dissolved minerals; they are deposited lower down or lost to groundwater and rivers. In high-rainfall, well-drained soils, leaching removes nutrients from the topsoil — which is why tropical soils can be nutrient-poor despite lush vegetation.
Four soil-forming factors (p 6):
1. Climate — rainfall and temperature control weathering and the rate of decomposition.
2. Parent material — the rock or sediment the soil forms from; determines mineral content and texture.
3. Slope — angle, aspect and drainage: steep slopes erode; flat, poorly drained slopes waterlog.
4. Organisms — vegetation, roots, worms, bacteria and fungi add and mix organic matter.
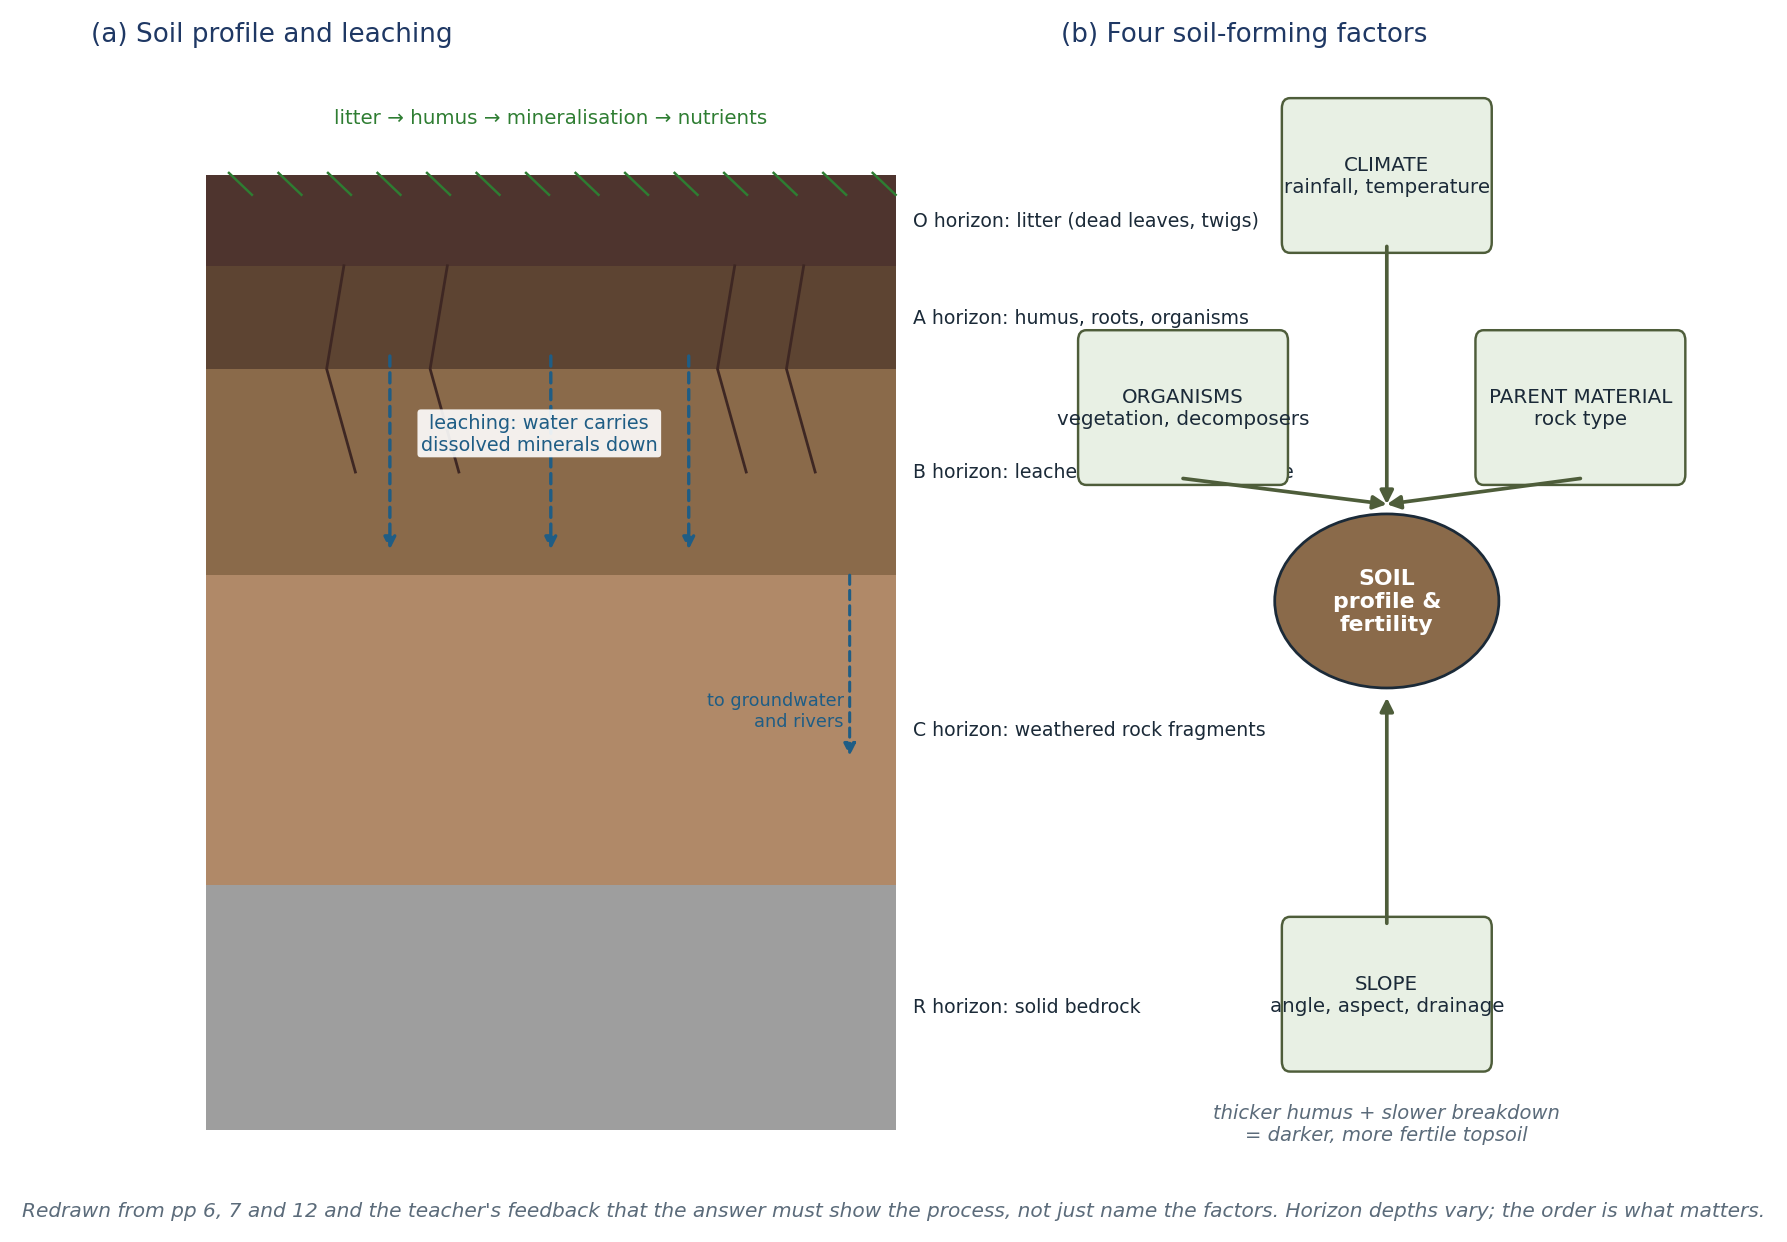
Figure 5.4 (a) Soil horizons and leaching; (b) the four soil-forming factors. Redrawn from pp 6, 7 and 12 to show how each factor works, as the teacher required.
"CHECK & CORRECT — ANSWER THE 'HOW', NOT JUST THE 'WHAT'" The teacher's comments on p 6 are the most useful markscheme in the packet: the diagram must show the process, and the factors must be explained. "Climate" alone earns nothing; "high rainfall increases leaching, which removes nutrients from the A horizon" earns the mark. |
5.6 Soil degradation and conservation (p 7)
- Causes: deforestation, overgrazing, poor management, compaction by machinery, removal of vegetation, bare soil exposed to rain and wind.
- Types: erosion, acidification, pollution, loss of organic matter, salinisation (irrigation in dry areas).
- Consequences: gullies, loss of topsoil, reduced fertility, silt and pollution downstream, lower yields.
- Conservation: reduce grazing pressure, plant vegetation strips and cover crops, plough carefully along contours, build terraces, add organic matter, avoid over-irrigation.
Rainsplash (p 12): raindrops detach soil particles and push them downslope — the first step in sheet erosion.
"CHECK & CORRECT — STATISTICS WITH CONTEXT" The p 7 reading quotes global figures for degraded land and lost arable land without a date or source. Treat them as claims in the packet, not current statistics. If you use one, write "the reading states that…" — do not present it as a today's figure. |
5.7 Worked example
"EXAMPLE — EXPLAIN A SOIL CATENA" Two sites on a hillside: A is steep and bare; B is gentle and covered with grass. Explain the likely difference in soil depth and fertility. Answer. A: rain runs off quickly, so infiltration is low; rainsplash and sheet erosion remove topsoil; the soil is thin, dry and low in organic matter. B: gentler slope and vegetation slow runoff, increase infiltration and trap sediment; roots and litter add humus; the soil is deeper and more fertile. Slope and vegetation are the controlling factors, with climate setting the overall rate. |
5.8 Self-test
1. Draw the rock cycle and label six processes.
2. Distinguish intrusive from extrusive igneous rock.
3. Why can only sedimentary rock contain fossils?
4. Distinguish weathering from erosion.
5. Name and explain three physical weathering processes.
6. Write the carbonation reaction in words.
7. Name four agents of erosion and one process for each.
8. Explain how a tor forms.
9. Label a karst cave: stalactite, stalagmite, column, sinkhole.
10. Explain leaching and why it matters for farming.
11. Name the four soil-forming factors and explain one.
12. Give three ways to reduce soil erosion.
CHAPTER 6
North America — Physical Landscapes & Waterways
Landform regions · mountains, basins and peaks · rivers, lakes and gulfs · Grand Canyon
Source pages: pp 8, 21, 31, 33, 36, 40, 42, 52, 61, 63
North America is a continent of belts: a western mountain system, a central plain, an eastern old mountain belt and a coastal plain. The class table divides it into eleven landform regions (pp 31, 42, 61). Learn each region with its diagnostic landform, not just its name.
6.1 The eleven landform regions
Region | Characteristic features | Formation / note |
Canadian Shield | Ancient Precambrian crystalline rock; ice-smoothed hills, thin soils, thousands of lakes and swamps; poor agriculture in the north, some farming in the south | Largest area of exposed ancient rock on Earth; long uplift and erosion; glaciated |
Arctic Coastal Plain | Low coastal plain along the Arctic Ocean; river deltas, thin recent sediments, exposed bedrock; hilly in places | Coastal deposition and erosion; permafrost |
Interior Plains (Lowlands) | Broad, generally flat; from central Saskatchewan to the Coastal Plain; bounded by the Great Plains (west), Canadian Shield (north/east) and Appalachians (east) | Tectonically stable; glaciated |
Great Plains | Vast high plateau of grassland — tallgrass east, shortgrass west; now largely farmland or overgrazed | Rain shadow of the Rockies; dry |
Rocky Mountains | 3,000 miles from Alberta/BC to New Mexico; peaks over 4,000 m; shallow soils; minerals; glacial and volcanic scenery | Folded and faulted; uplifted |
Intermountain Basins & Plateaus | Basins and ranges between the Rockies and the Pacific ranges; Colorado Plateau; canyons, mesas, intermittent streams | Crustal stretching and uplift; river incision |
Pacific Mountains & Valleys | Coast Mountains, Coast Ranges, Cascades, Sierra Nevada, Central Valley; fjords, volcanoes, deep canyons | Plate movement: folding, faulting, intrusion, transform motion |
Interior Highlands | Ozarks/Ouachitas in Oklahoma, Arkansas and Missouri; >6,000 caves in Missouri limestone | Ancient uplifted plateau; groundwater solution |
Appalachian Highlands | ~2,000 miles from Newfoundland to Alabama; old, rounded mountains; natural barrier to westward movement | Ancient uplift, then long erosion |
Piedmont | Rolling plateau 90–550 m; rivers cut into it; fertile soils; cotton, tobacco, fruit | Eroded edge of the Appalachians |
Gulf–Atlantic Coastal Plain | Flat, low plain from Texas to New Jersey; sandy beaches, poor soils, cotton/tobacco, Florida citrus, petroleum | Sediment washed from the Appalachians |
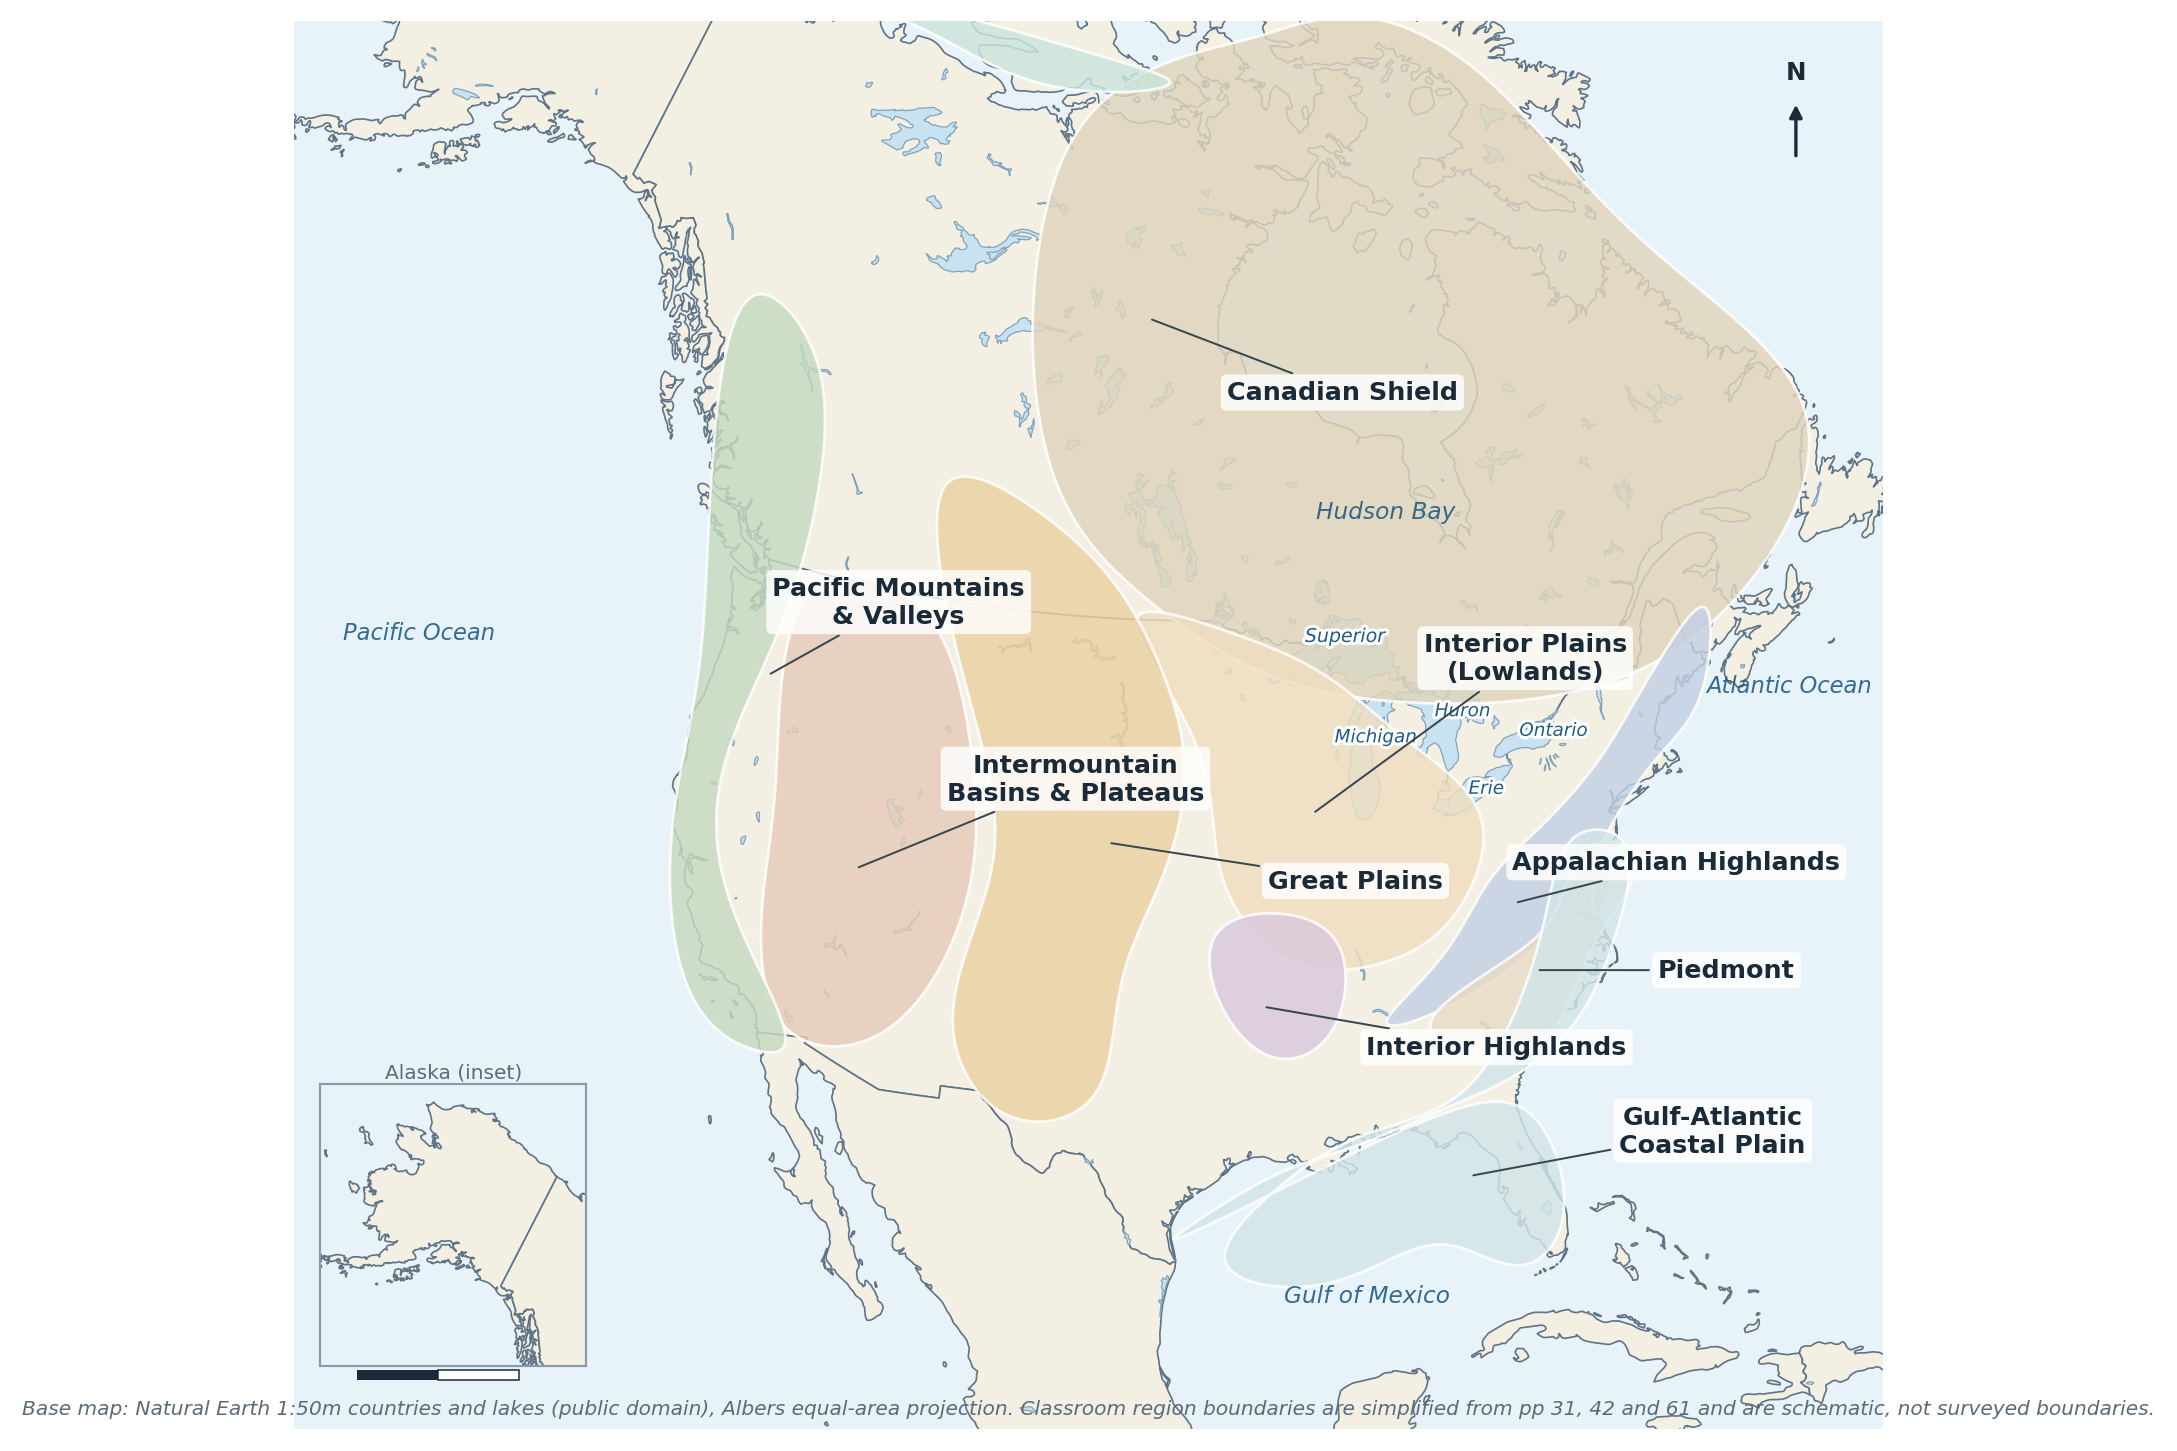
Figure 6.1 The eleven classroom landform regions on a real North American base map. Boundaries are schematic (pp 31, 42, 61).
"CHECK & CORRECT — NAMES AND PLACEMENTS" The teacher corrected several p 42 placements: the Mackenzie Mountains are in the north-west (not the same as the Mackenzie River), the Brooks Range is in northern Alaska, and "Rockies Canada" was added. The Shield drawing was marked as not showing its characteristics. Use the corrected placements here, not the original row order. |
6.2 Mountains, peaks, basins and canyons
- Mount McKinley (Denali) — 6,190 m, Alaska, highest peak in North America. The packet uses the older name; both are acceptable if you note the change.
- Mount Logan — 5,959 m, Yukon, highest peak in Canada.
- Death Valley — lowest, hottest and driest place in North America (−86 m), California/Nevada.
- Great Basin — a large arid region of basins and ranges between the Rockies and the Sierra Nevada.
- Grand Canyon — a massive canyon cut by the Colorado River in Arizona.
- Colorado Plateau — high plateau of flat-lying sedimentary rock, cut into mesas and canyons.
- Continental Divide — the line that separates drainage flowing to the Pacific from drainage flowing to the Atlantic and Arctic.
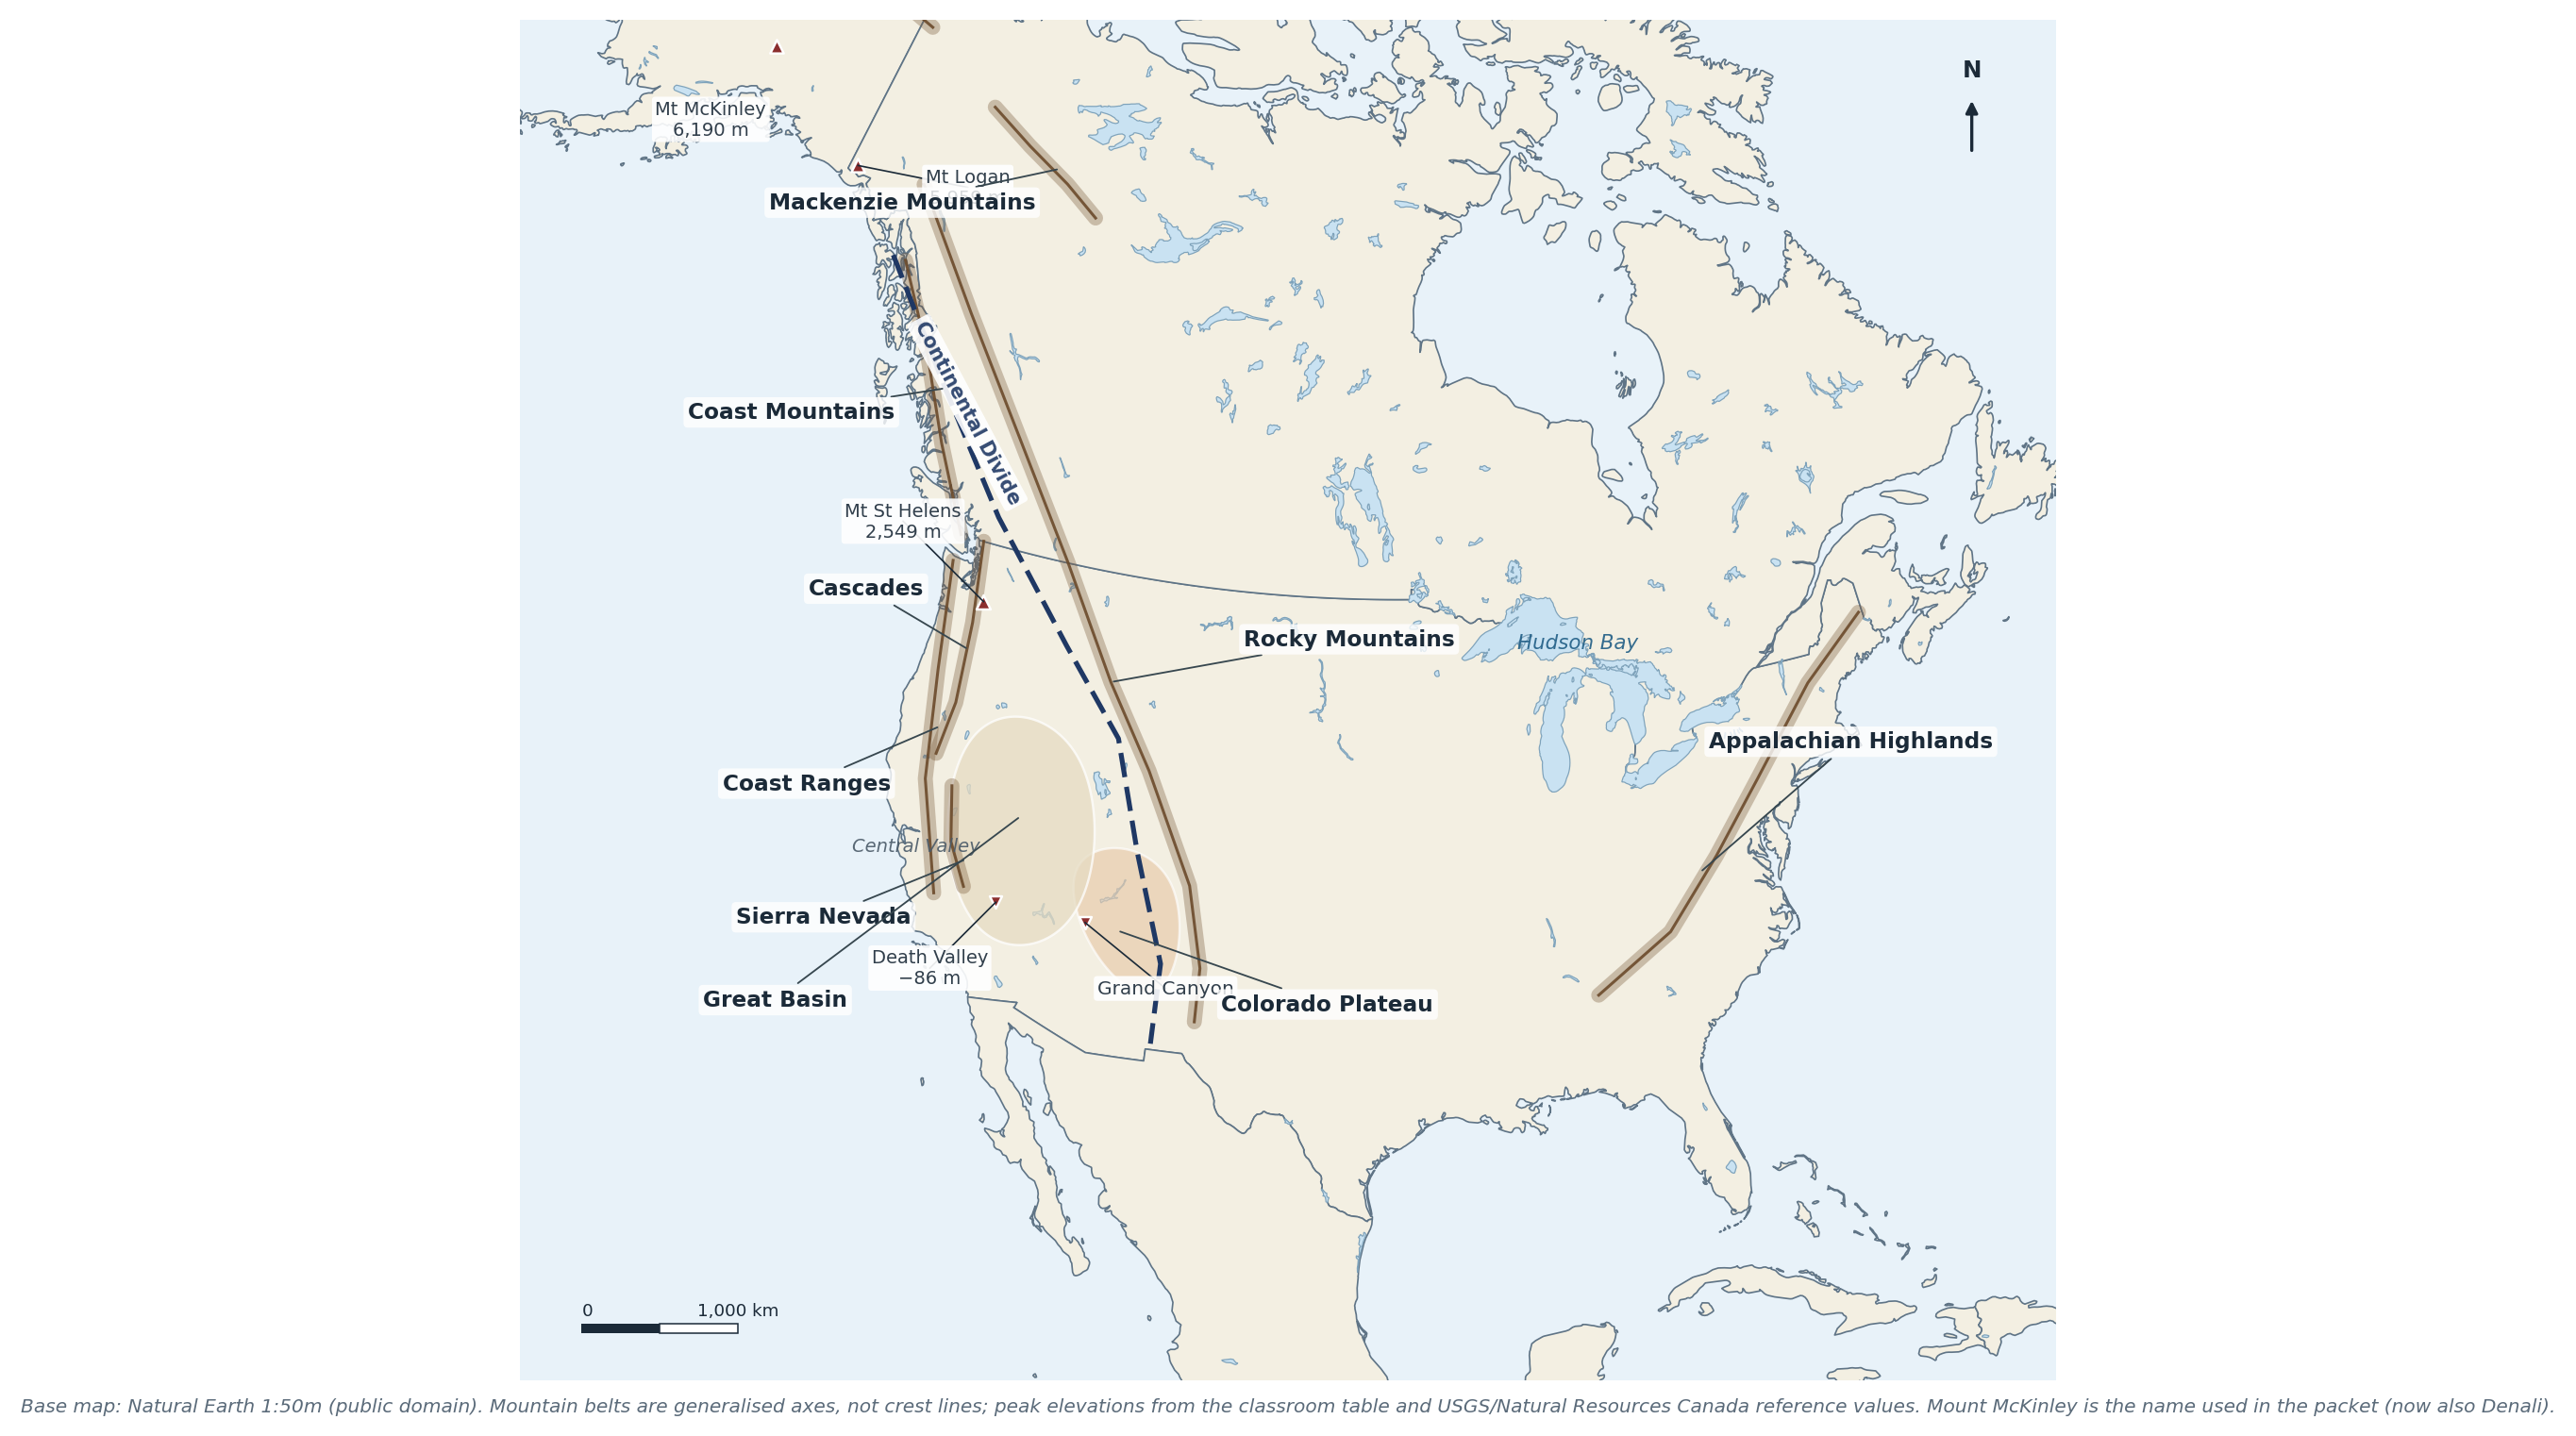
Figure 6.2 Mountain belts, plateaus, basins, peaks and the Continental Divide. Base map: Natural Earth; labels from pp 31, 36 and 42.
6.3 Rivers, lakes, gulfs and the Divide
- Rivers: Mackenzie (to the Arctic), St Lawrence (Great Lakes to the Atlantic), Mississippi–Missouri–Ohio (to the Gulf of Mexico), Rio Grande (USA–Mexico border), Colorado (to the Gulf of California), Columbia (Pacific Northwest).
- Great Lakes: Superior, Michigan, Huron, Erie, Ontario — the largest group of freshwater lakes in the world; they drain east through the St Lawrence.
- Hudson Bay is a bay, not a lake.
- Gulfs: Mexico, Alaska, California. Oceans: Arctic, Pacific, Atlantic.
- Drainage: the Continental Divide sends water west to the Pacific and east/north to the Atlantic and Arctic. The Mississippi system drains the interior to the Gulf.
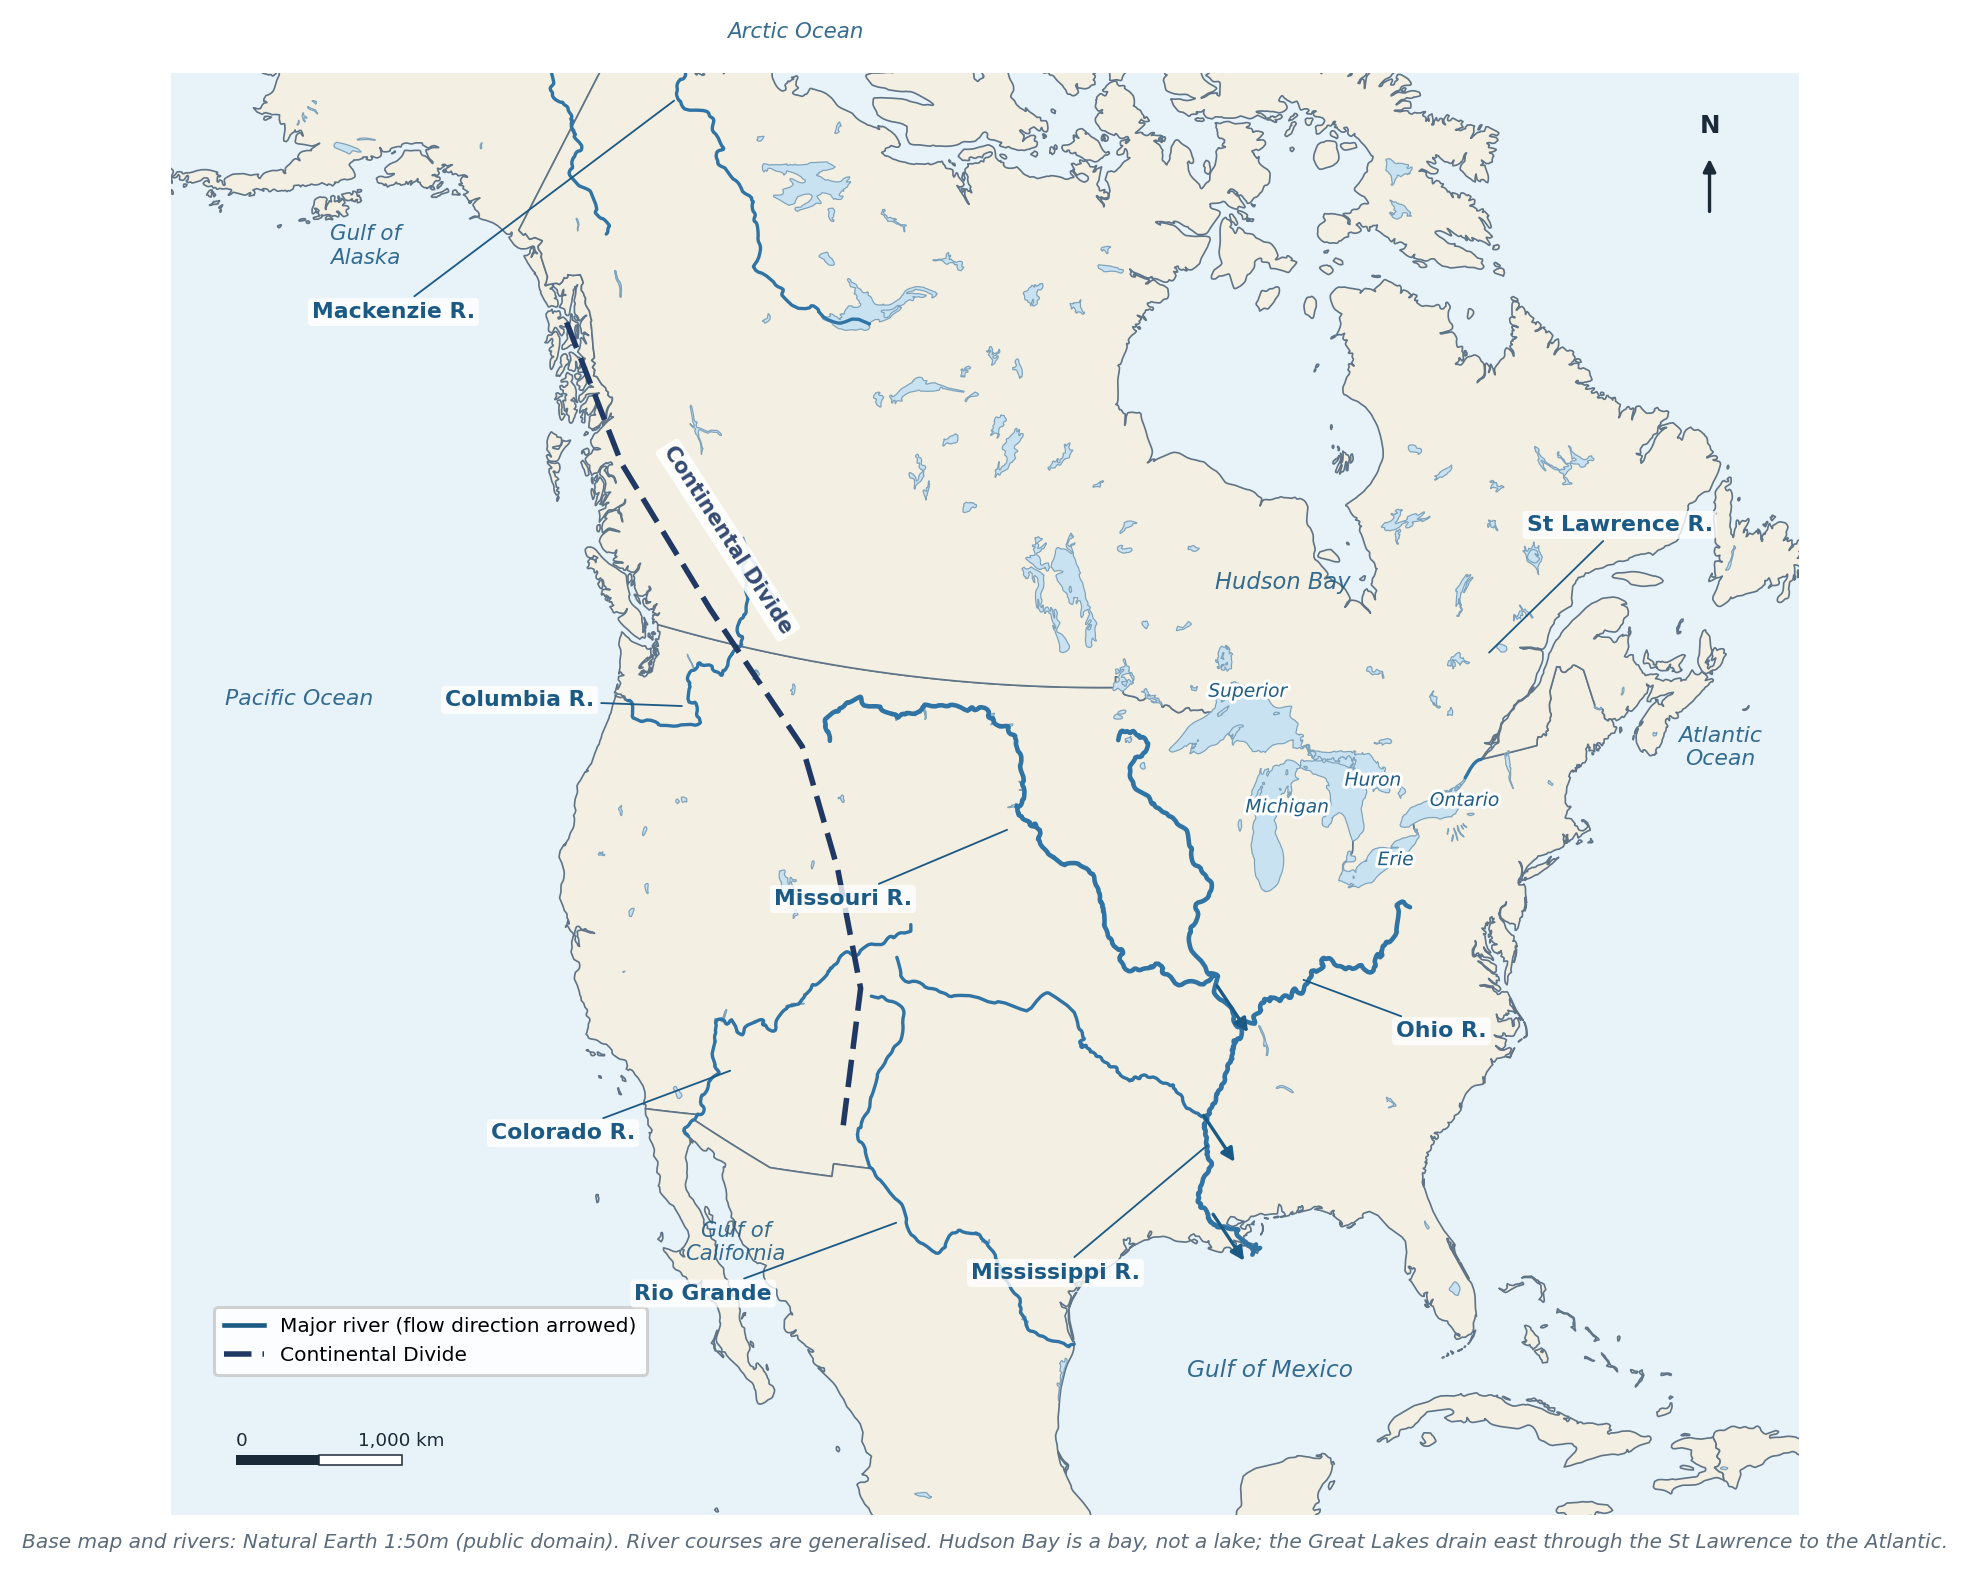
Figure 6.3 Rivers, lakes, gulfs and the Continental Divide. Base map and rivers: Natural Earth.
"CHECK & CORRECT — THE DIVIDE ON THE CLASS MAP" On p 36 the Continental Divide is marked with a red X and moved west by the teacher; the original line ran too far east. The Divide follows the crest of the Rockies, not the middle of the plains. The p 42 notes also confuse the Mackenzie River (which flows north to the Arctic) with the Mackenzie Mountains. |
6.4 Grand Canyon: D–U–D–E
The formation mnemonic on p 33 is D–U–D–E:
1. Deposition — horizontal layers of sediment accumulate, usually under water.
2. Uplift — tectonic forces raise the Colorado Plateau, so the river's gradient steepens.
3. Downcutting — the river cuts vertically into the rising rock, keeping its channel.
4. Erosion — side valleys, rockfall and runoff widen the canyon.
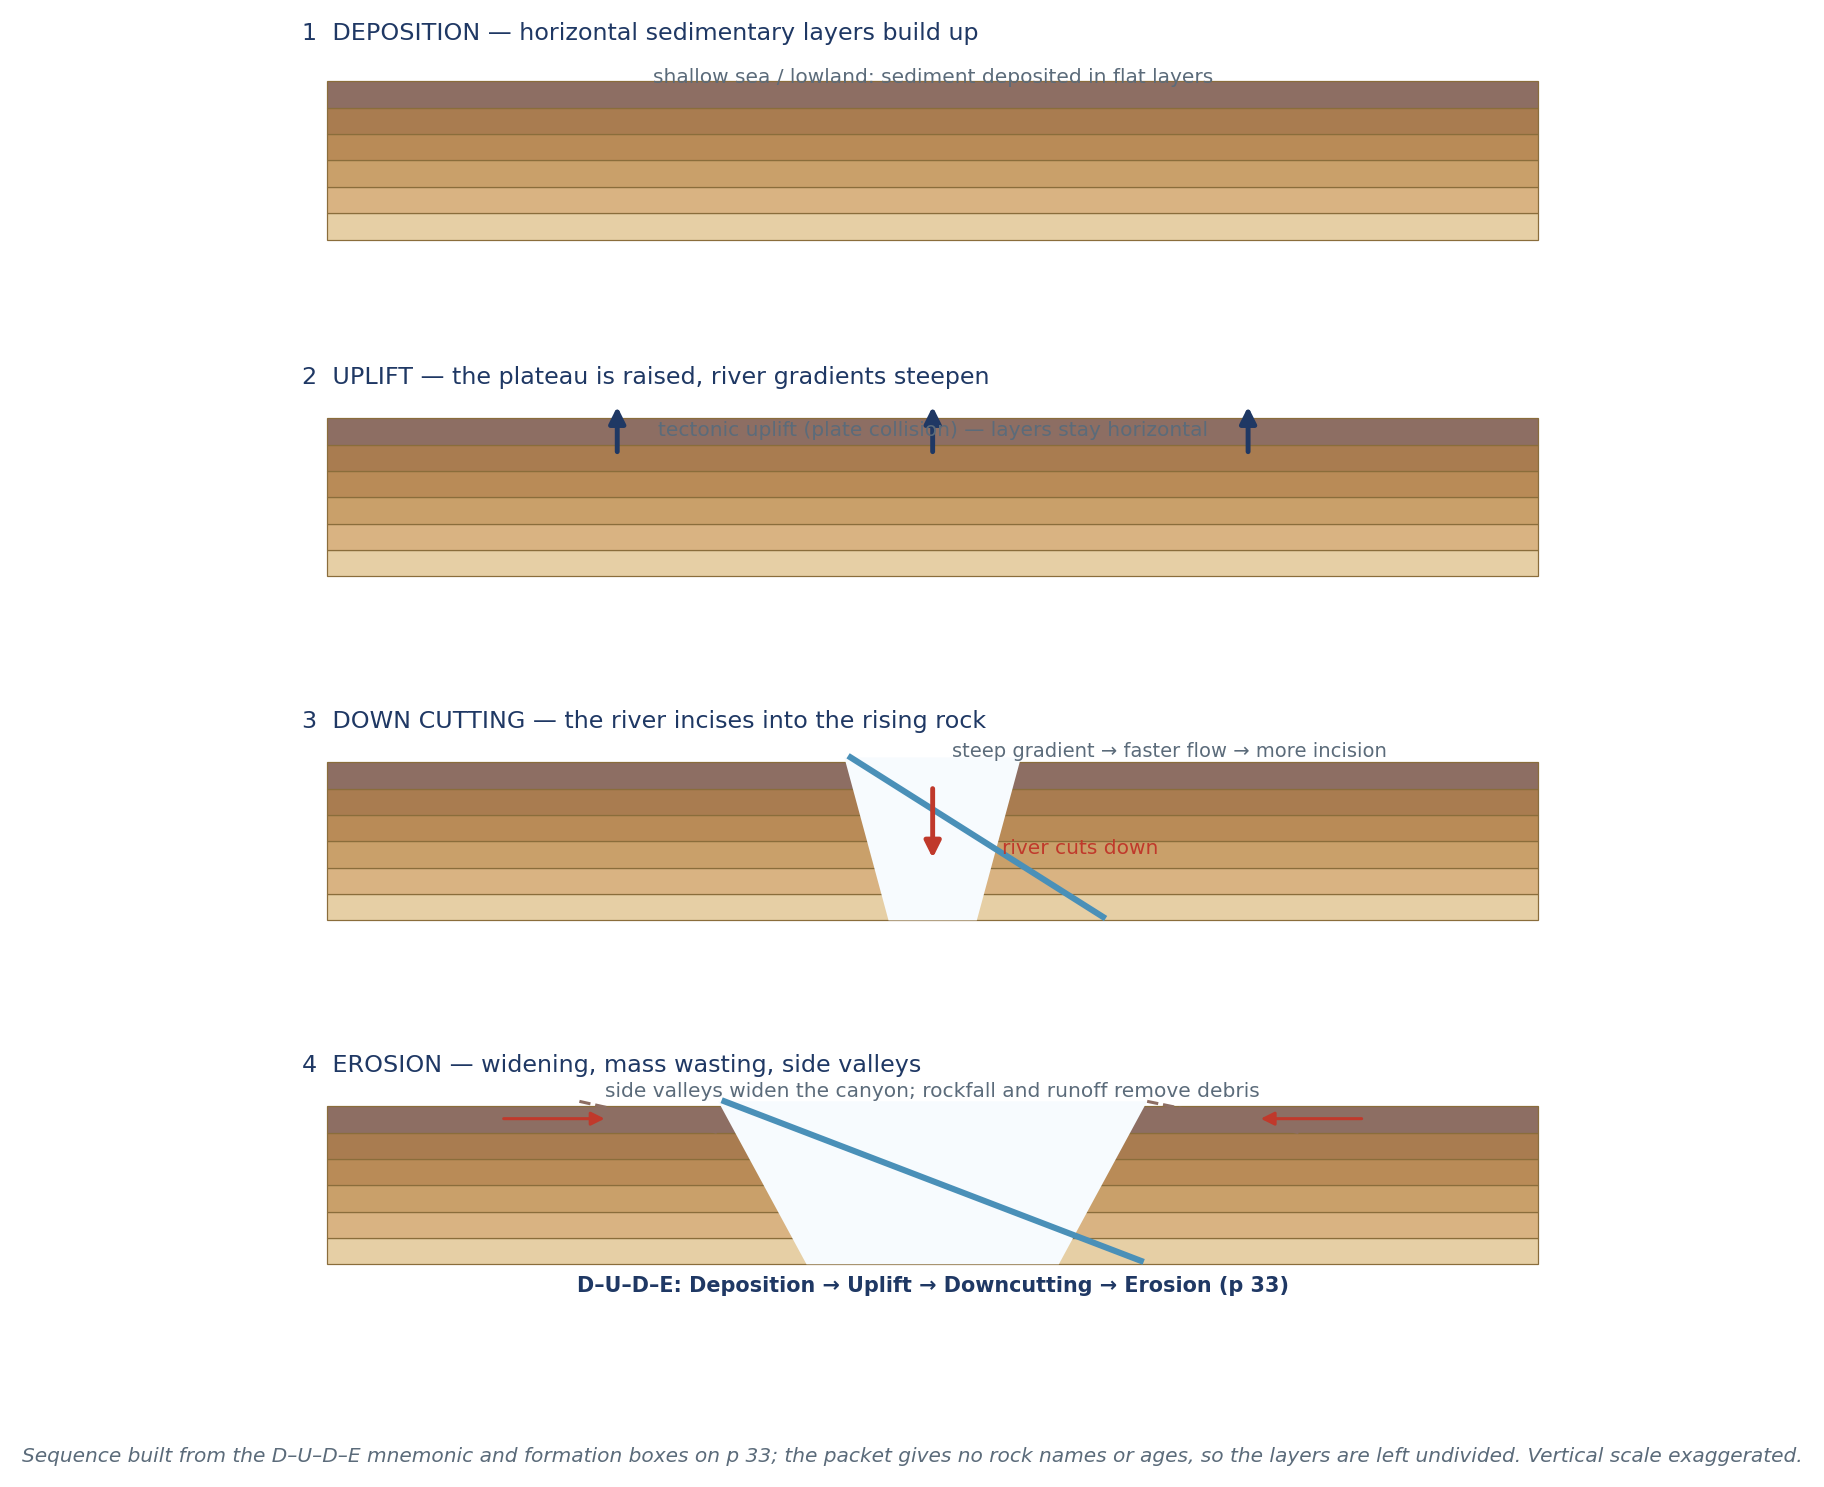
Figure 6.4 The four stages of canyon formation. Built from p 33; the packet gives no rock names or ages, so layers are undivided.
"CHECK & CORRECT — NO INVENTED AGES" The p 33 boxes for rock names and geological time are blank. Do not fill in "1.8 billion years" or "Kaibab Limestone" as if they came from the packet. State the sequence and the processes; that is what the mnemonic tests. |
6.5 The park question (p 52)
p 52 asks about GD / DV / BC national parks and the two shaping forces. The initials are not expanded anywhere in the packet, so they stay as written. The two forces are:
- Tectonic uplift / mountain-building — the rock is raised.
- Erosion — water, ice and gravity carve it.
"PARK INITIALS" GD, DV and BC are kept exactly as the packet writes them. Only uplift and erosion — the forces p 52 states — are recorded. No park names are guessed. |
6.6 The west–east transect (p 63)
From the Pacific to the Atlantic: coastal plain → Coast Ranges → Central Valley → Sierra Nevada → Basin and Range → Rocky Mountains → Great Plains → Mississippi lowland → Appalachian Plateau → Atlantic Coastal Plain. Each step changes relief, climate and land use — which is why the transect is a good revision tool.
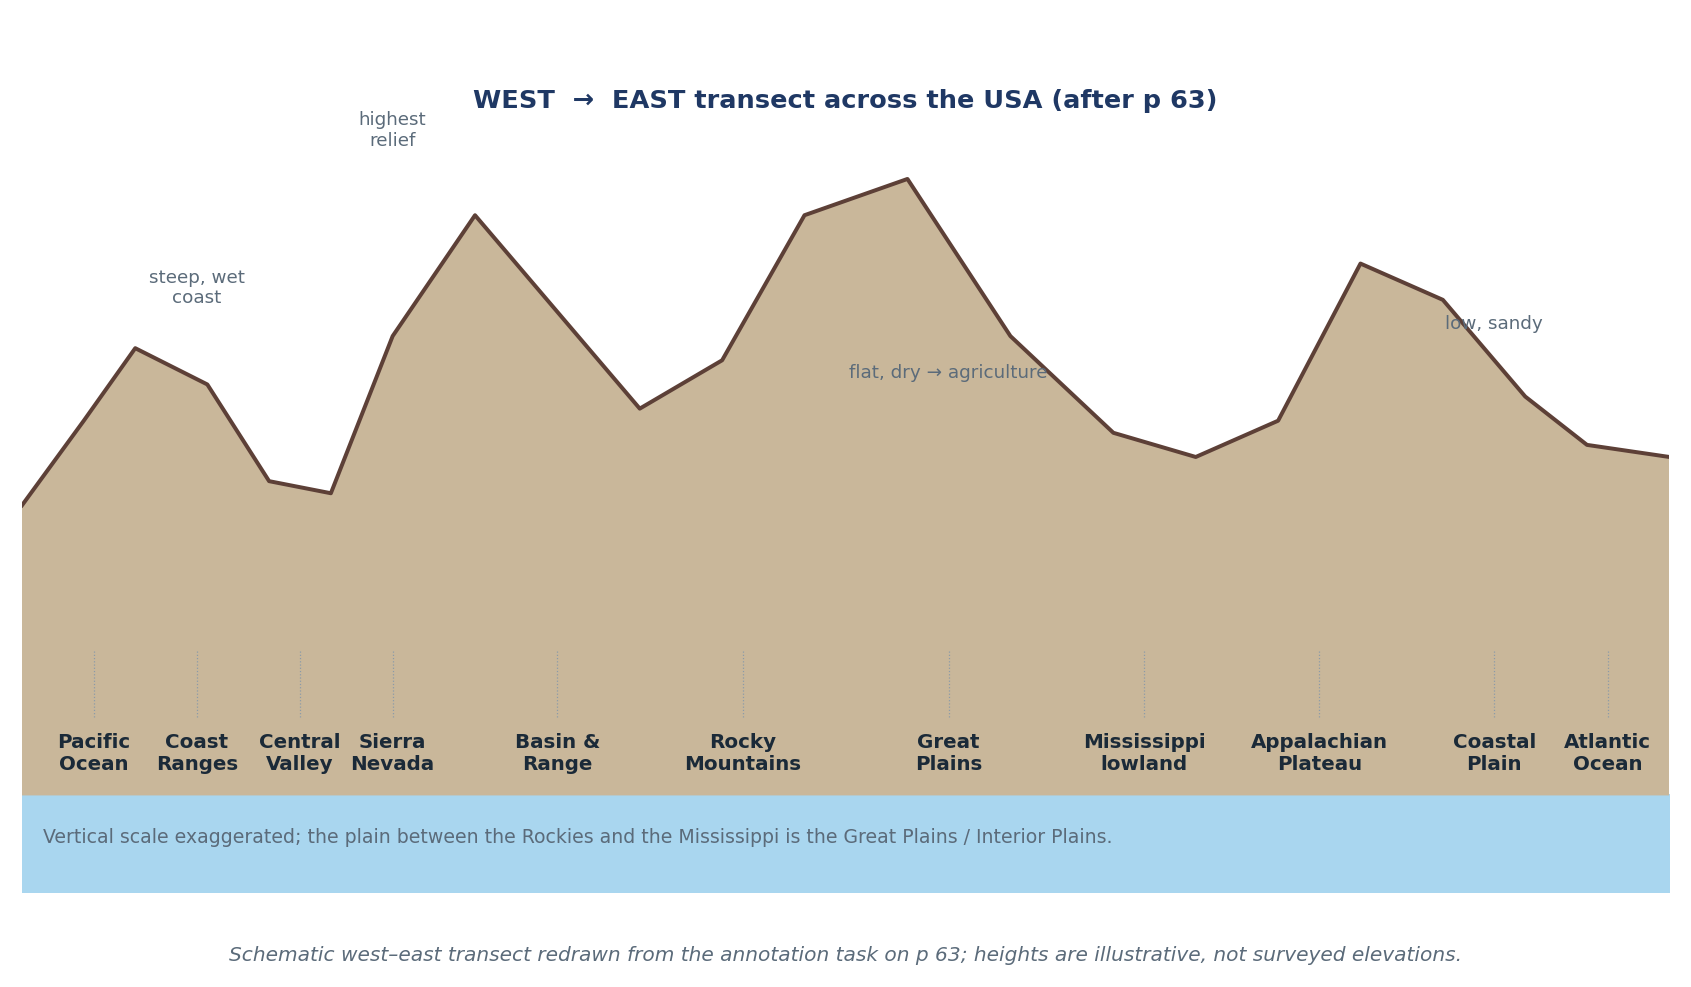
Figure 6.5 West–east transect across the USA, redrawn from the p 63 annotation task. Heights are illustrative.
6.7 Self-test
1. Name the eleven landform regions.
2. Which region is the largest area of ancient exposed rock on Earth?
3. Why are the Great Plains dry?
4. Give the highest peak in North America and in Canada.
5. Where is Death Valley and what is special about it?
6. Name the five Great Lakes and the river that drains them.
7. What is the Continental Divide?
8. Why is Hudson Bay not a lake?
9. Put the Grand Canyon stages in order and explain each.
10. What are the two shaping forces in the GD/DV/BC question?
CHAPTER 7
Resources, Agriculture & Economic Regions
Climate, water and soil → farming · belts · forestry, mining and energy · economic regions
Source pages: pp 21–23, 27–28, 53, 56
North America feeds and powers itself from an unusually favourable base: fertile soils, fresh water, oil, minerals and forests (p 23). This chapter connects that base to the map of crops, resources and economic regions.
7.1 What makes agriculture productive
Three factors (p 23):
1. Climate — temperature and rainfall determine which crops can grow; length of growing season matters.
2. Water — rainfall, rivers, groundwater and irrigation.
3. Fertile soil — deep, nutrient-rich, well-drained soil.
North America's advantage is the combination: temperate climates with adequate rain, deep grassland soils (mollisols) and large river systems for irrigation and transport.
7.2 The crop belts
Belt | Location | Crops / livestock | Why there |
Dairy Belt | Wisconsin, Michigan, New York, Ontario, Quebec | Milk, cheese, butter | Cool, moist climate; good pasture; near large cities |
Corn Belt | Iowa, Illinois, Indiana, Nebraska, Minnesota | Maize, soybeans, pigs, cattle | Deep soils, warm summers, reliable rain |
Wheat Belt | Kansas, Nebraska, Dakotas, Alberta, Saskatchewan, Manitoba | Spring wheat (Canada), winter wheat (Kansas) | Semi-arid, cool; large flat fields |
Cotton & tobacco | Southeast (Carolinas, Georgia, Alabama) | Cotton, tobacco | Long hot growing season; sandy/loamy soils |
Citrus | Florida, Rio Grande Valley, Central Valley | Oranges, grapefruit, lemons | Subtropical warmth; irrigation where dry |
Fruit & vegetables | Central Valley, Great Lakes, Columbia Basin, Finger Lakes, Niagara | Apples, peaches, grapes, vegetables | Mild microclimates, drainage, frost protection |
Ranching | South-west USA, northern Mexico | Cattle, sheep | Dry grassland; irrigation and feedlots |
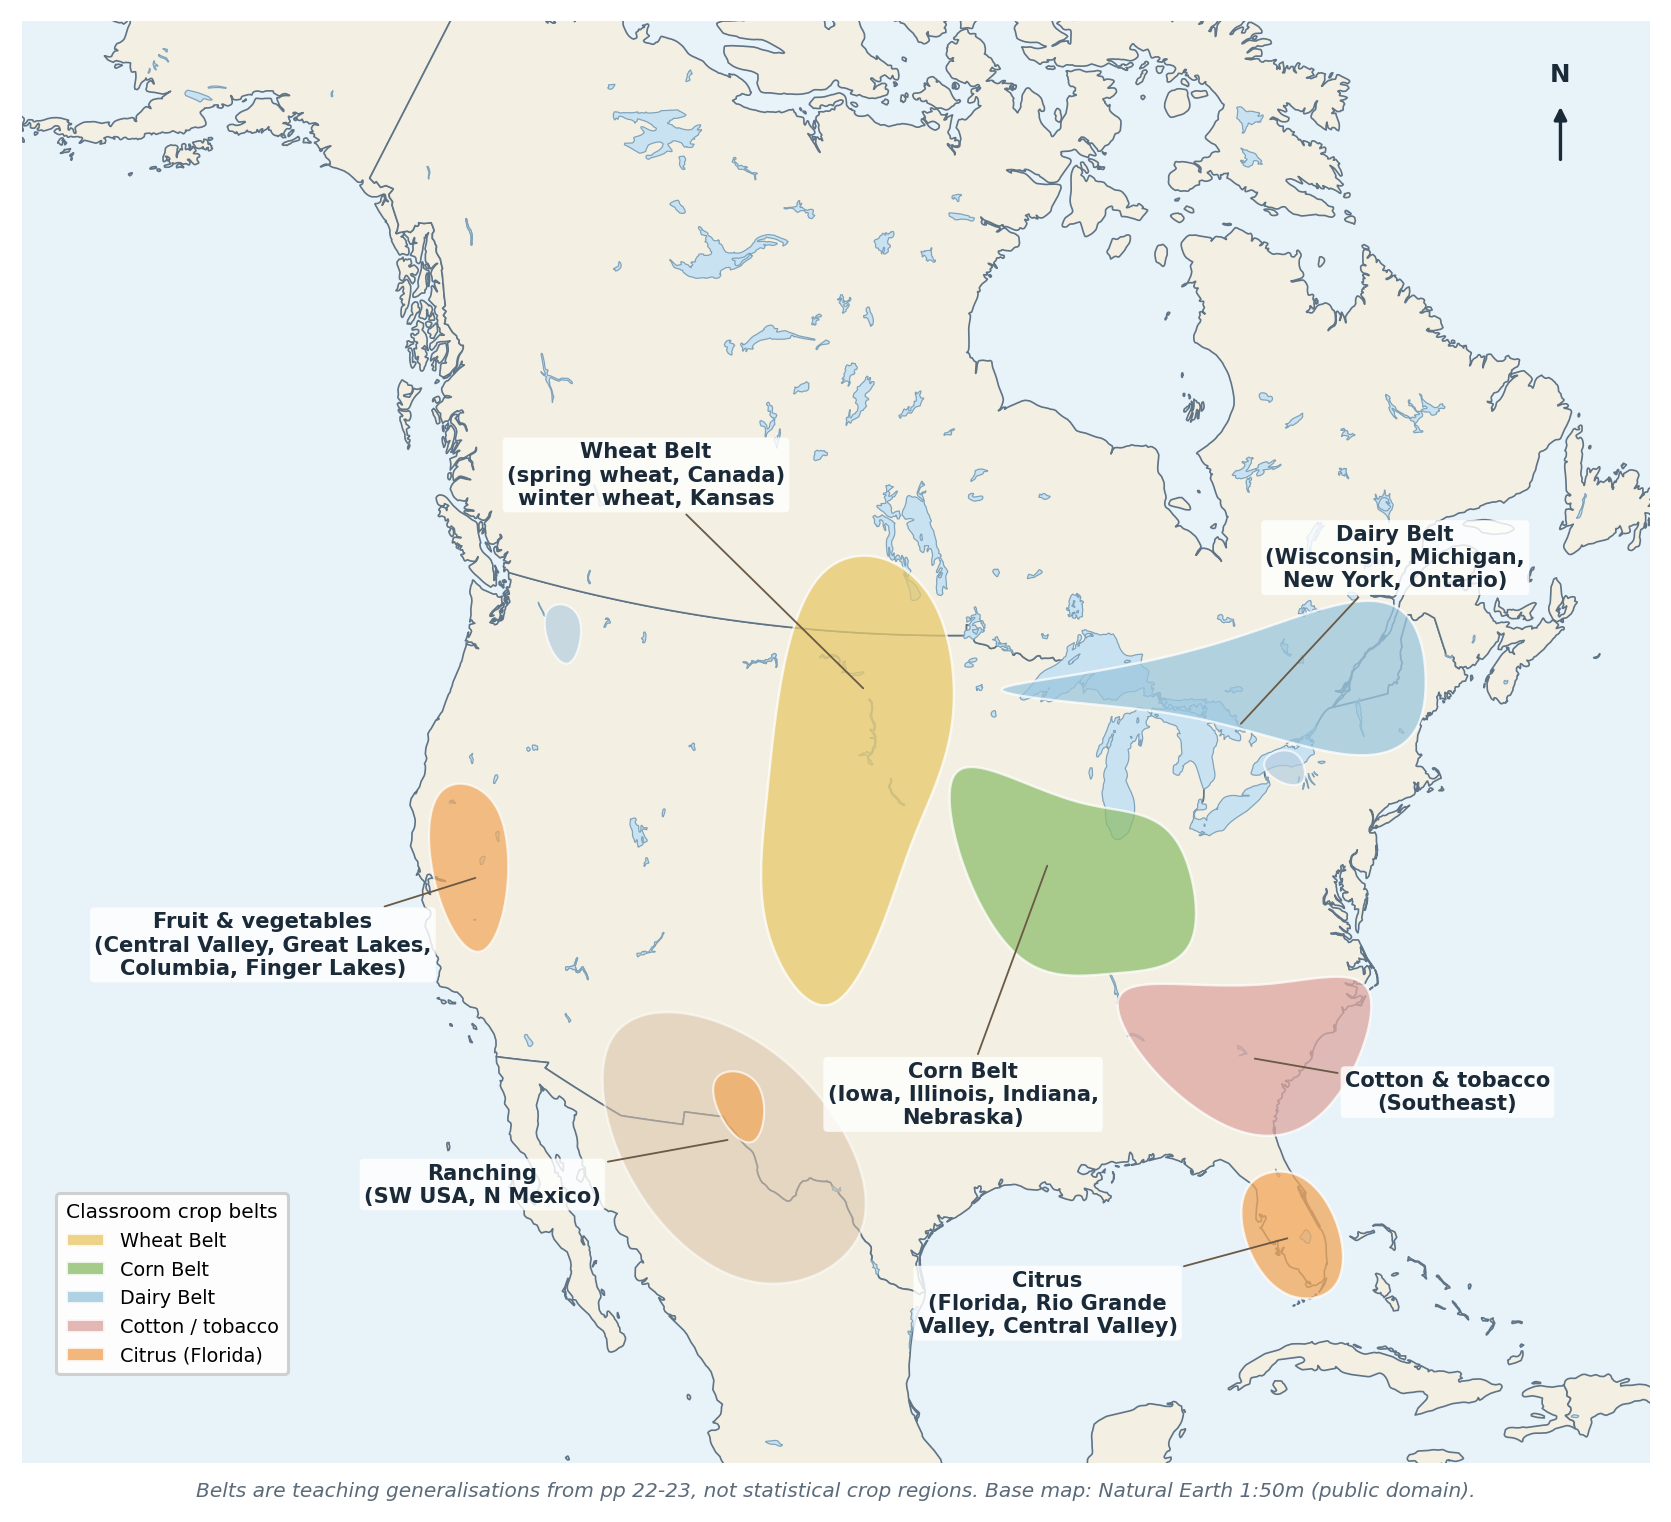
Figure 7.1 The classroom crop belts on a real base map. Belts are teaching generalisations (pp 22–23), not statistical regions.
"CHECK & CORRECT — PERCENTAGES NEED A DATE" The p 22 answers estimate that about 50% of the USA and 6% of Canada is agricultural land. The packet gives no source or date. Treat these as student estimates; if you use them, say "roughly half of the USA's land is farmland" and note that the figure includes pasture. |
7.3 Water: transport, irrigation, power and fish
- Great Lakes–St Lawrence Seaway — carries bulk goods (iron ore, grain) from the interior to the Atlantic.
- Mississippi–Missouri–Ohio — drains the interior to the Gulf of Mexico; a cheap route for grain and coal.
- Mackenzie — flows north to the Arctic; important locally, not a major trade route.
- Irrigation — vital in the dry west (Central Valley, Great Plains); over-extraction depletes aquifers (p 22).
- Hydropower — major schemes on the Columbia and in Quebec/BC; renewable but disruptive to rivers and fish.
- Fishing — Grand Banks, Pacific coast, Gulf of Mexico; important historically, now limited by overfishing.
7.4 Forests, minerals and energy
- Forestry — the Pacific Northwest, the Gulf and South Atlantic states, Quebec, Ontario and BC. Softwoods (cedar, fir, spruce) are used for lumber, export, construction, paper, cardboard and fibreboard (p 28).
- Minerals — the Canadian Shield (iron, nickel, copper, gold, uranium); the western states (gold, silver, copper, uranium); Appalachian coal (ancient plants, buried, mined underground and by open pit, burned for electricity); Arkansas diamonds.
- Oil and gas — the Gulf Coast, Alberta (oil sands) and the Arctic; used for fuel, electricity, plastics and chemicals.
- Mining is a primary industry; processing (steel, refining) is secondary; services are tertiary.
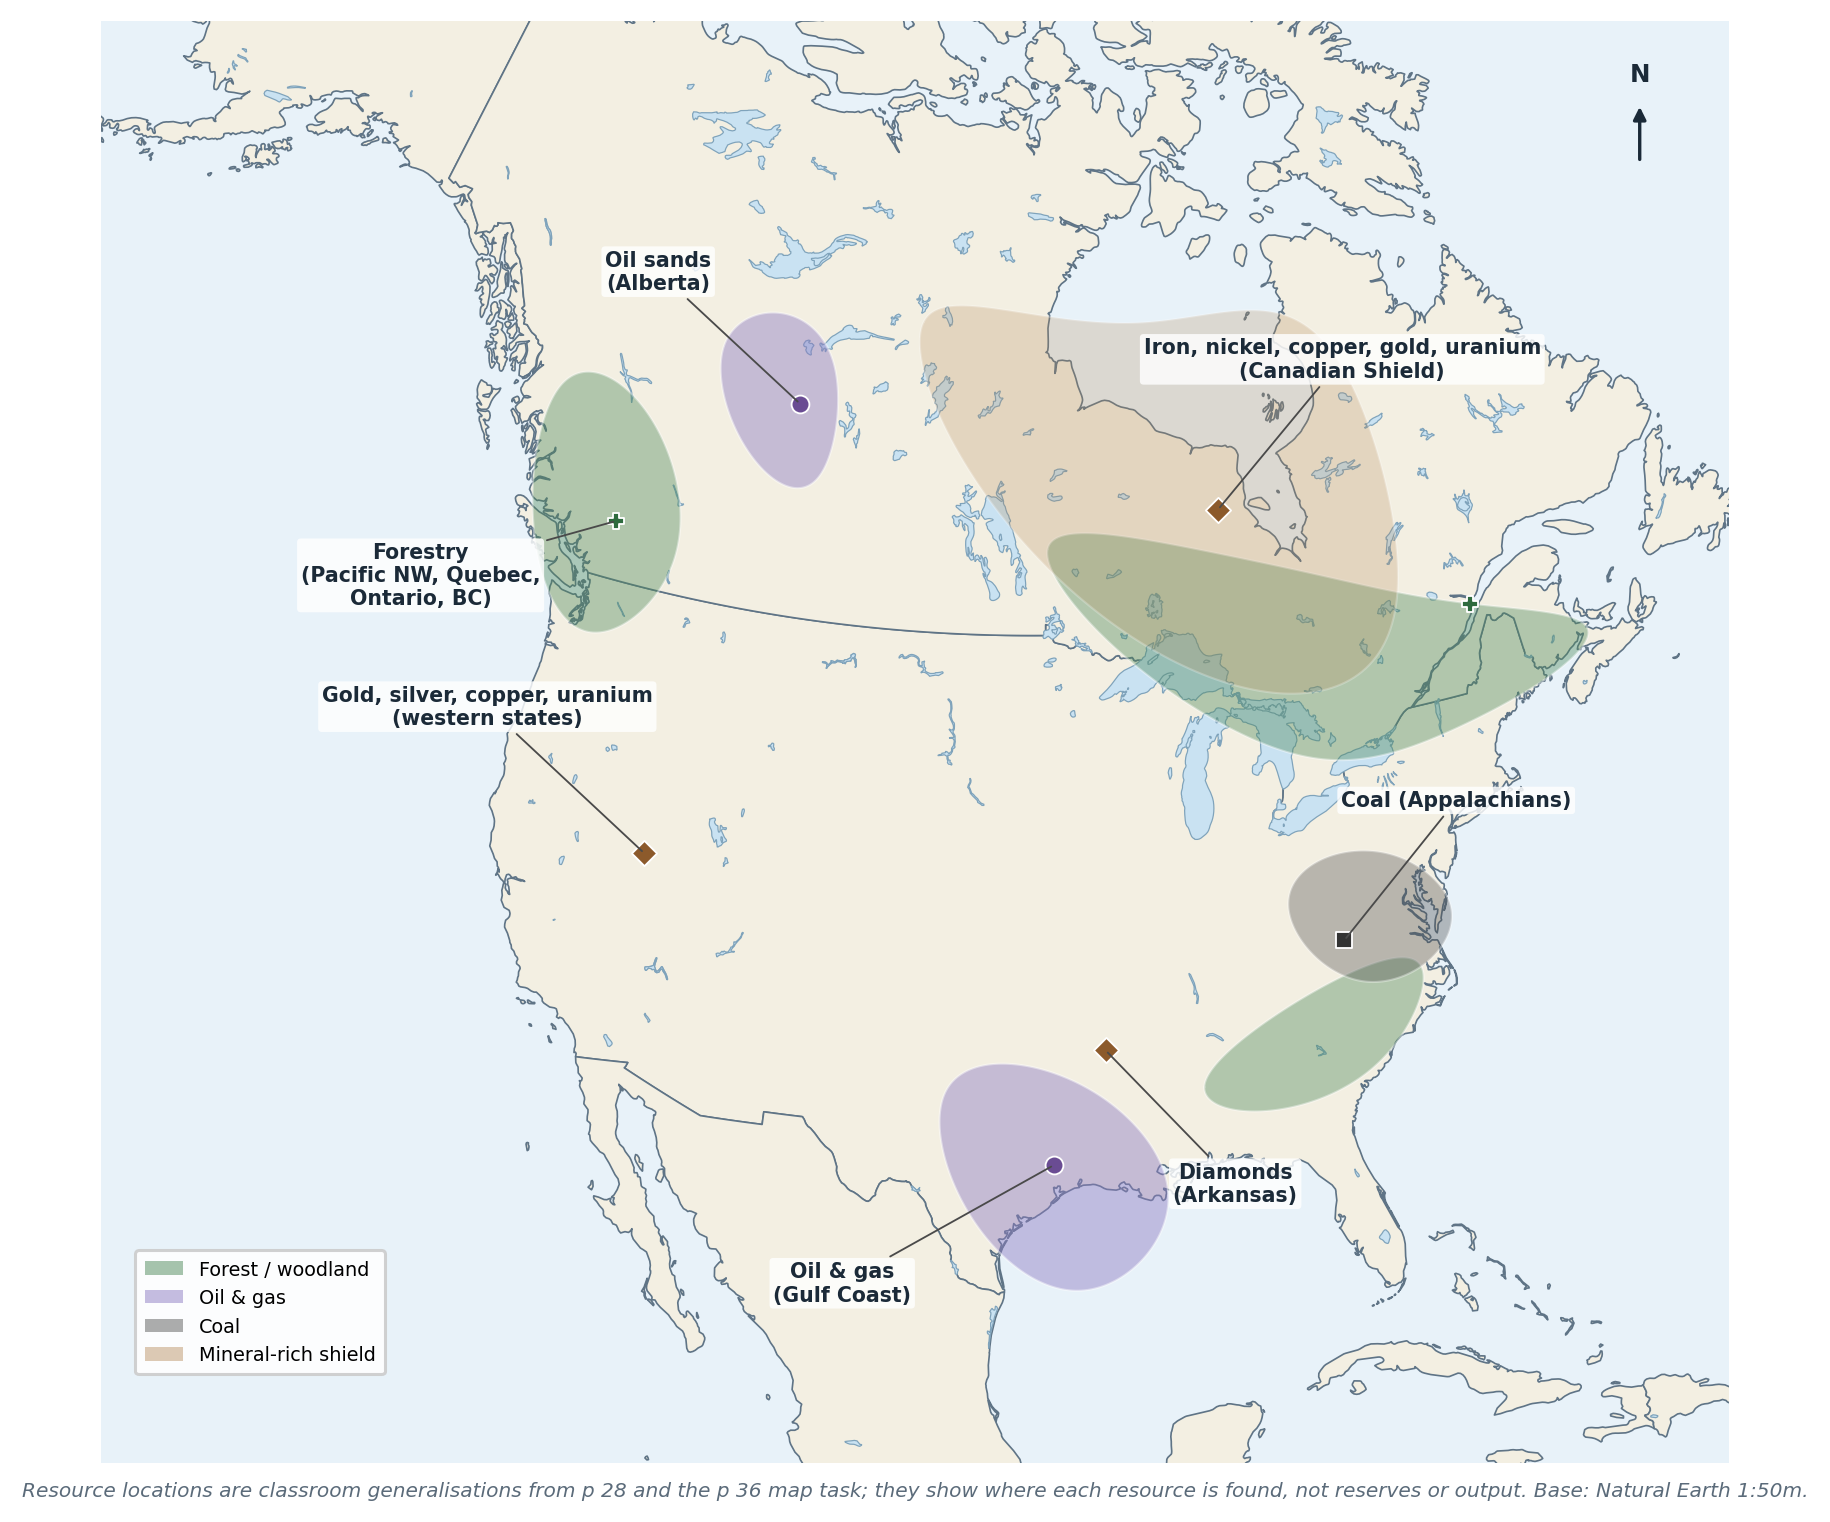
Figure 7.2 Forest, coal, oil and gas, and mineral locations. Classroom generalisations from p 28; base map Natural Earth.
"EXPLAIN THE 'WHY' AS WELL AS THE 'WHERE'" A resource answer earns more when it links location to geology: coal is in the Appalachians because ancient tropical forests were buried and compressed there; oil is in the Gulf because marine organisms were buried in sediments; minerals are in the Shield because ancient crystalline rock is exposed. |
7.5 Economic and cultural regions (p 27)
USA: Northeast (finance, services, old industry), South (agriculture, energy, growing population), Midwest (farming and manufacturing), West (resources, technology, large federal land).
Canada: Atlantic Provinces (fishing, forestry, tourism), Core Provinces (Ontario and Quebec — manufacturing and finance), Prairie Provinces (wheat, cattle, oil and gas), Pacific Province and Territories (forestry, mining, tourism).
This is the classroom scheme, which differs from official census regions — use the packet's grouping, not a substituted one.
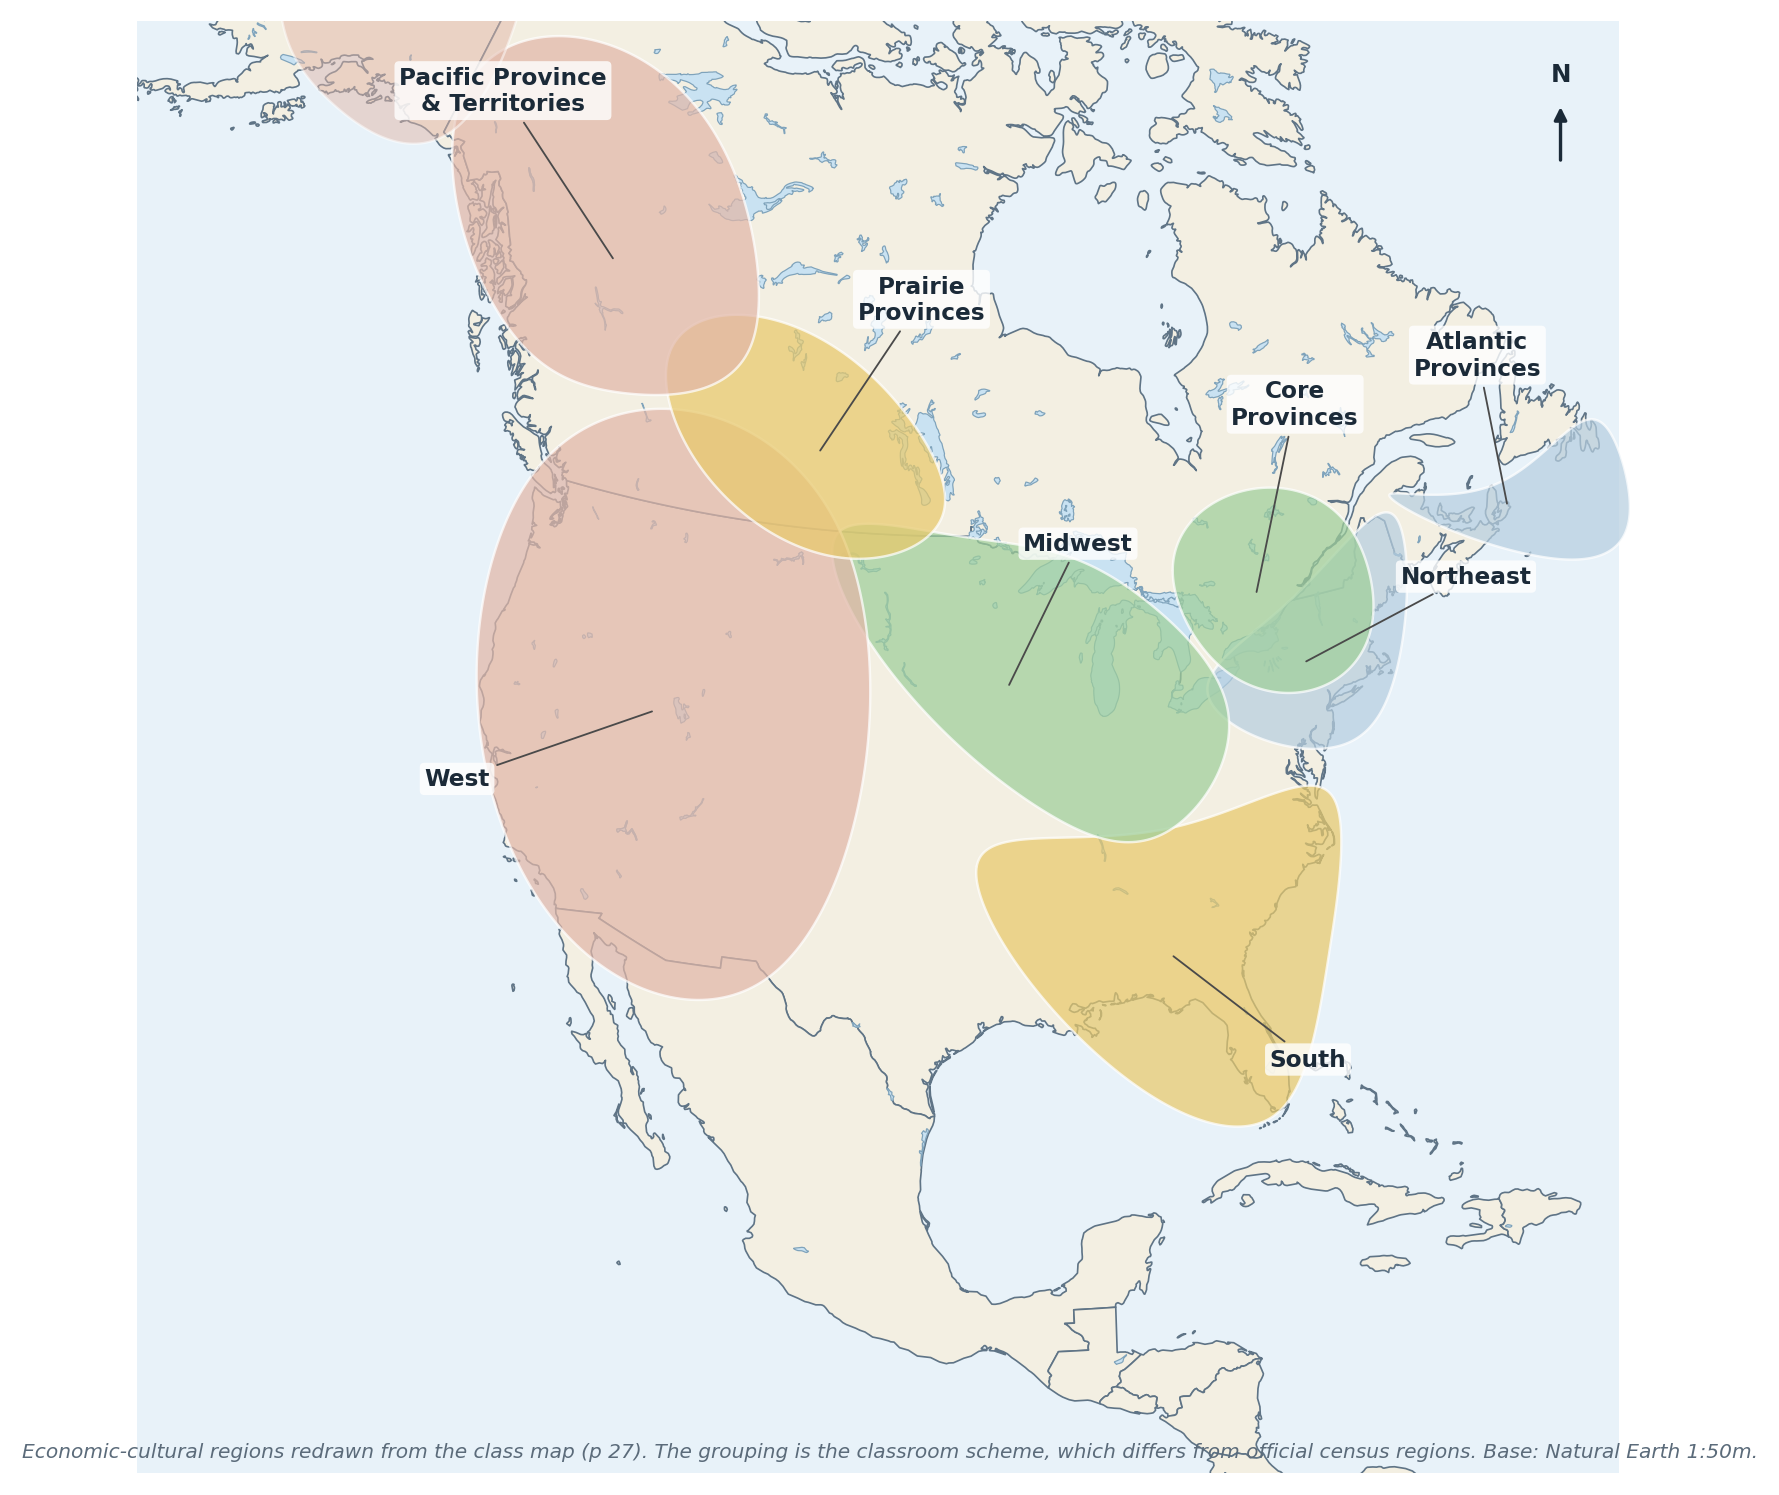
Figure 7.3 The USA and Canada economic-cultural regions from the class map (p 27).
7.6 Worked example
"EXAMPLE — EXPLAIN A DAIRY BELT" Why is dairying concentrated in Wisconsin, Michigan, New York and Ontario rather than in Kansas? Answer. Dairying needs moisture, cool temperatures and good pasture (cows tolerate heat poorly), and it needs markets nearby because milk is perishable. The Dairy Belt has cool summers, reliable rain, glacially enriched soils and large nearby cities. Kansas is drier, hotter in summer and further from big urban markets, so it specialises in wheat instead. The comparison shows that climate sets the broad limits and market access decides within them. |
7.7 Self-test
1. Name the three factors that make agriculture productive.
2. Where is the Corn Belt and why there?
3. Compare spring wheat and winter wheat locations.
4. Why is dairying near cities?
5. Name three uses of water in North America.
6. What is the St Lawrence Seaway used for?
7. Give three forest products and where forestry is important.
8. Why is there coal in the Appalachians?
9. Name the four US and four Canadian economic regions.
10. Why is the classroom region scheme not the same as official census regions?
CHAPTER 8
People, Indigenous Cultures & Early History
Migration · Indigenous cultural regions · exploration and colonies · immigration and identity
Source pages: pp 9, 11, 13, 35, 43, 45–48, 53, 56–57, 63
Human geography in North America begins with migration: people arrived from Asia across the Beringia land bridge more than 12,000 years ago (pp 56, 57), spread across two continents, and developed cultures adapted to very different environments. Later, European exploration and colonisation reorganised the continent — with enormous consequences for those peoples.
8.1 Indigenous cultural regions (p 11)
Region | Environment | Way of life |
Arctic | Ice, tundra, sea | Hunting sea mammals and caribou; igloos and skin tents |
Subarctic | Taiga and waterlogged tundra | Hunting, fishing, trapping; toboggans, snowshoes, canoes; small mobile family groups |
Northwest Coast | Wet, forested coast, rich sea | Fishing (salmon), cedar houses, totem poles, potlatch |
Plateau | Rivers and mountains between the Coast and the Rockies | Fishing and hunting; winter villages |
Great Basin | Desert, salt flats, brackish lakes | Gathering roots, seeds and nuts; hunting; mobile wickiups |
California | Fertile coast and valleys | Hunter-gatherers in small family groups; limited agriculture |
Southwest | Dry plateau and desert | Irrigation farming (maize, beans, squash); adobe pueblos |
Great Plains | Grassland | Buffalo hunting; mobile tipis; horse culture after European contact |
Northeast | Forests, lakes, fertile soil | Farming (maize, beans, squash), hunting, longhouses |
Southeast | Humid, fertile | Agriculture (maize, beans, squash, tobacco, sunflowers), towns, ceremonies |
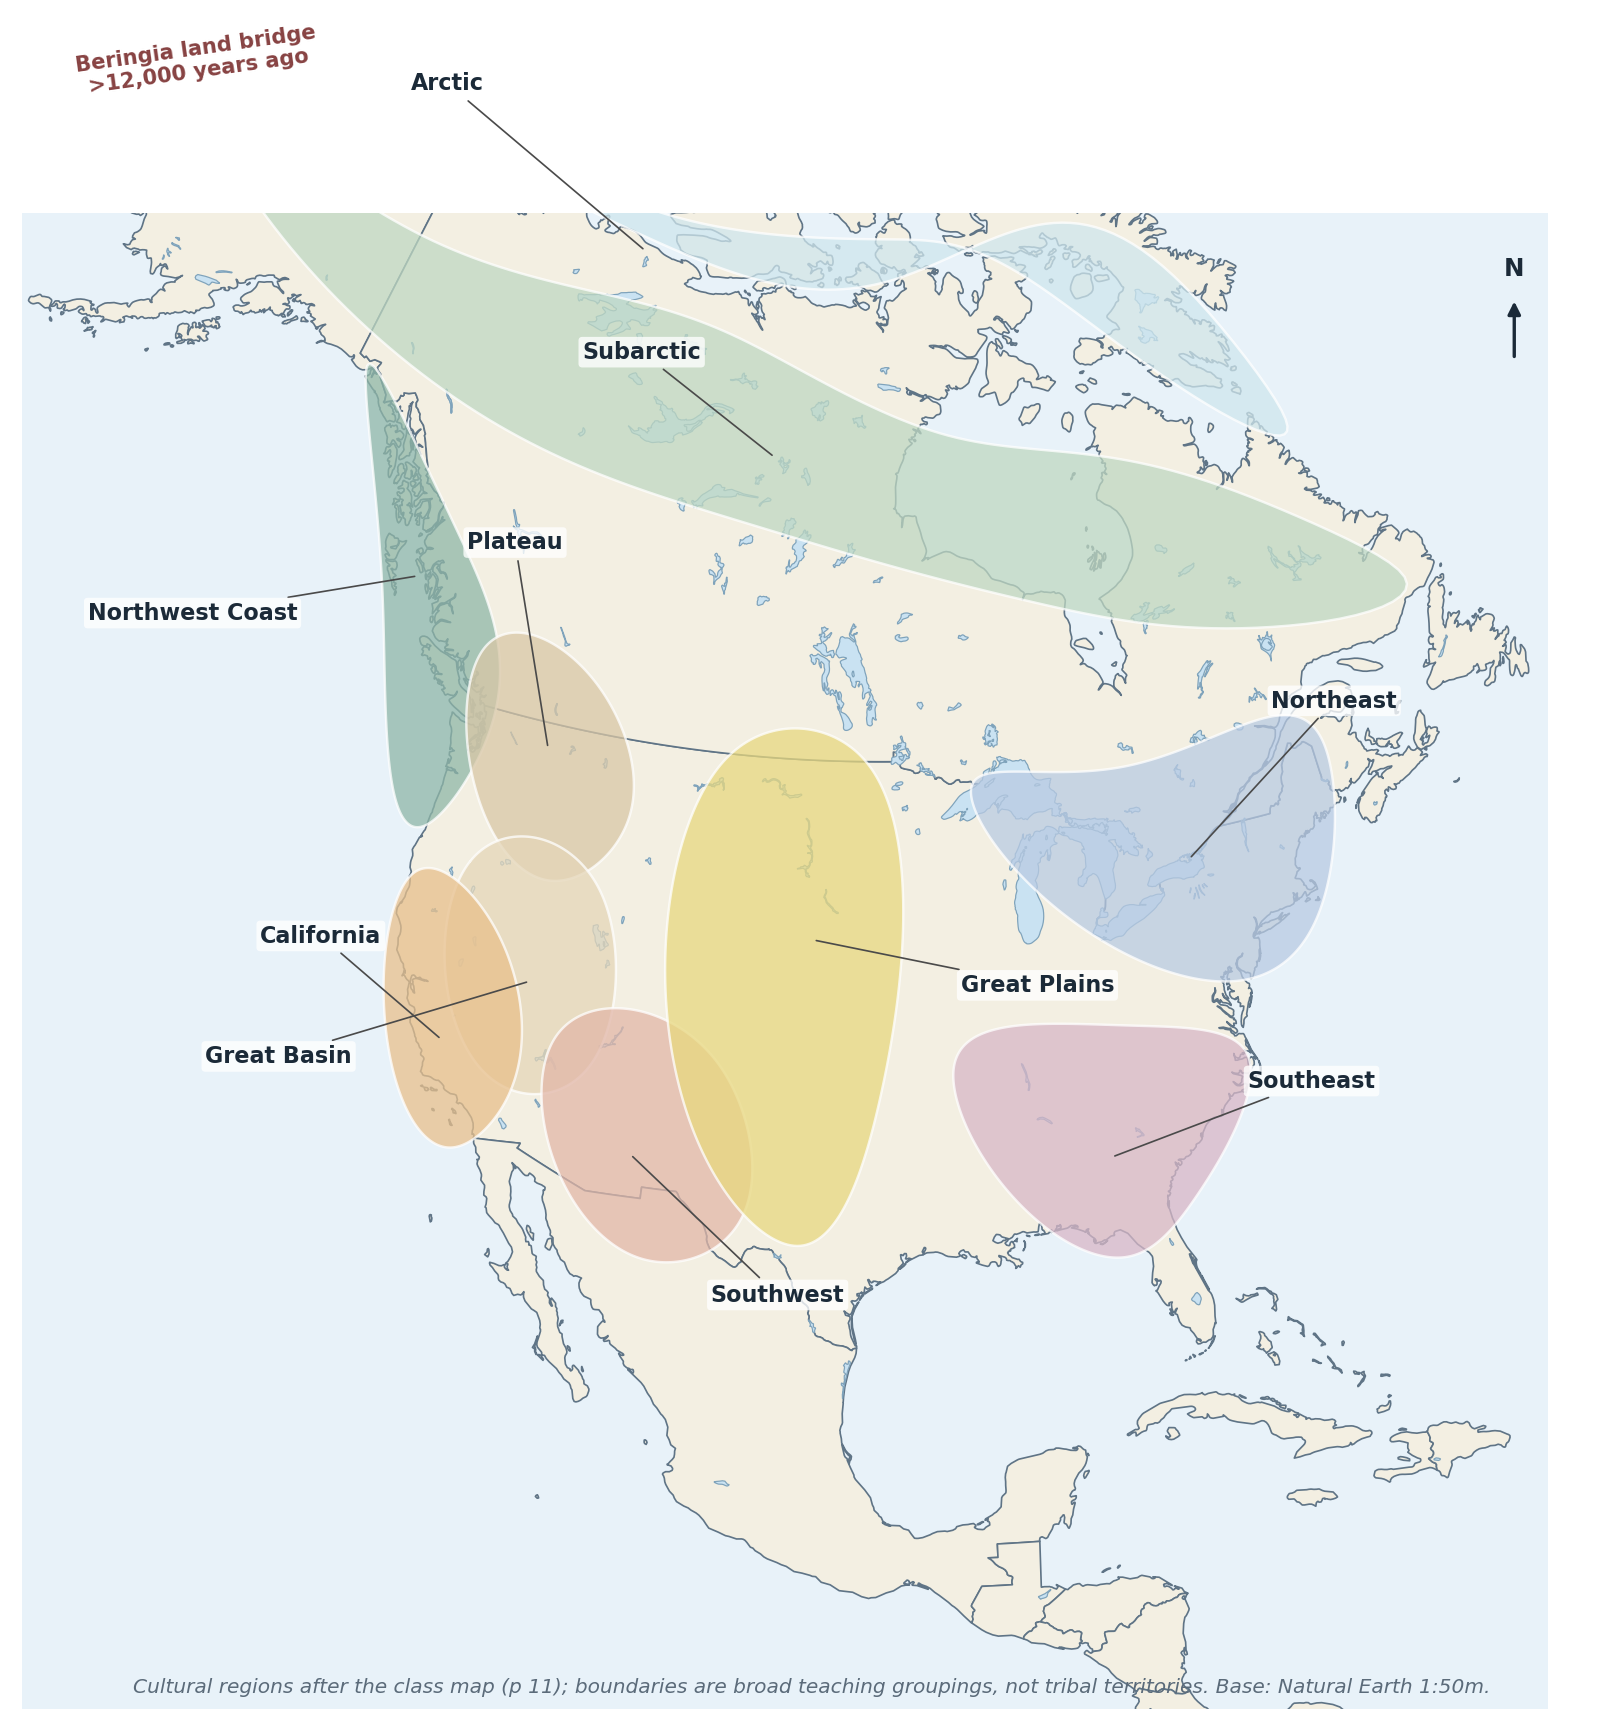
Figure 8.1 Broad Indigenous cultural regions of North America (after p 11) and the Beringia migration route. Cultural regions are not tribal territories.
"CHECK & CORRECT — GENERALISATIONS ARE NOT UNIVERSALS" The p 11 table is a classroom summary, not a description of every people in a region. Many groups combined farming, hunting and gathering; borders were fluid. Write "typically" or "in general" rather than "all Indigenous peoples". |
8.2 Human–environment interaction
Indigenous peoples modified their environments (controlled burning, clearing, irrigation, terraces), adapted to them (clothing, housing, seasonal movement) and depended on them (fish, game, plants, water). The p 13 writing task asks you to compare this with European colonists, who were more oriented to trade and resource extraction, but who also farmed, hunted and adapted.
"COMPARISON ANSWERS (P 13)" Use Idea → Analysis → Structure → Mechanics. Say what each group did, explain why the environment shaped it, and compare like with like (food, housing, land use, trade). Do not simply describe one group and then the other. |
8.3 European exploration (p 57)
Explorer | Date | Sponsor | Main achievement |
Vikings (Norse) | c. 1000 | Scandinavia | Reached Newfoundland (L'Anse aux Meadows); short-lived |
Columbus | 1492 | Spain | Reached the Caribbean; began Spanish colonisation |
Cortés | 1519 | Spain | Conquered the Aztec empire (Mexico) |
Pizarro | 1530s | Spain | Conquered the Inca empire (Peru) |
Cartier | 1534 | France | Explored the St Lawrence; Montreal; fur trade |
Cabot | 1497 | England | Reached Newfoundland; basis for English claims |
Colonial goals: Spain — gold and silver, conversion, empire; France — fur trade and strategic control of rivers; England — settlement, land and trade.
"CHECK & CORRECT — COLUMBUS AND THE 'VIKINGS'" p 57 says Columbus "never stepped foot on America". This is ambiguous: he never reached the mainland of the present USA, but he did reach the Americas (the Caribbean and South America). The Norse reached North America about 500 years before Columbus, but their settlement was abandoned — do not reduce that to a single cause. Pizarro was not "10 years later" than Cortés in a simple sense; give the 1530s date. |
8.4 The Thirteen Colonies (pp 35, 43)
- New England: New Hampshire, Massachusetts, Rhode Island, Connecticut. Rocky soils, forests, fishing, shipbuilding; founded largely for religious freedom (Pilgrims and Puritans).
- Middle Colonies: New York, New Jersey, Pennsylvania, Delaware. Fertile soil, diversity, Quakers in Pennsylvania (William Penn), tolerance.
- Southern Colonies: Maryland, Virginia, North Carolina, South Carolina, Georgia. Plantations, tobacco, rice, indigo; enslaved African labour; Maryland founded as a Catholic refuge; Georgia as a buffer against Spanish Florida.
Key dates and details: Roanoke (lost colony, Raleigh); Jamestown 1607 (Virginia Company, James River); Plymouth 1620 (Pilgrims); Massachusetts Bay 1630 (Puritans); New Netherland → New York (Dutch); Carolina split in 1729; Georgia 1732 (Oglethorpe).
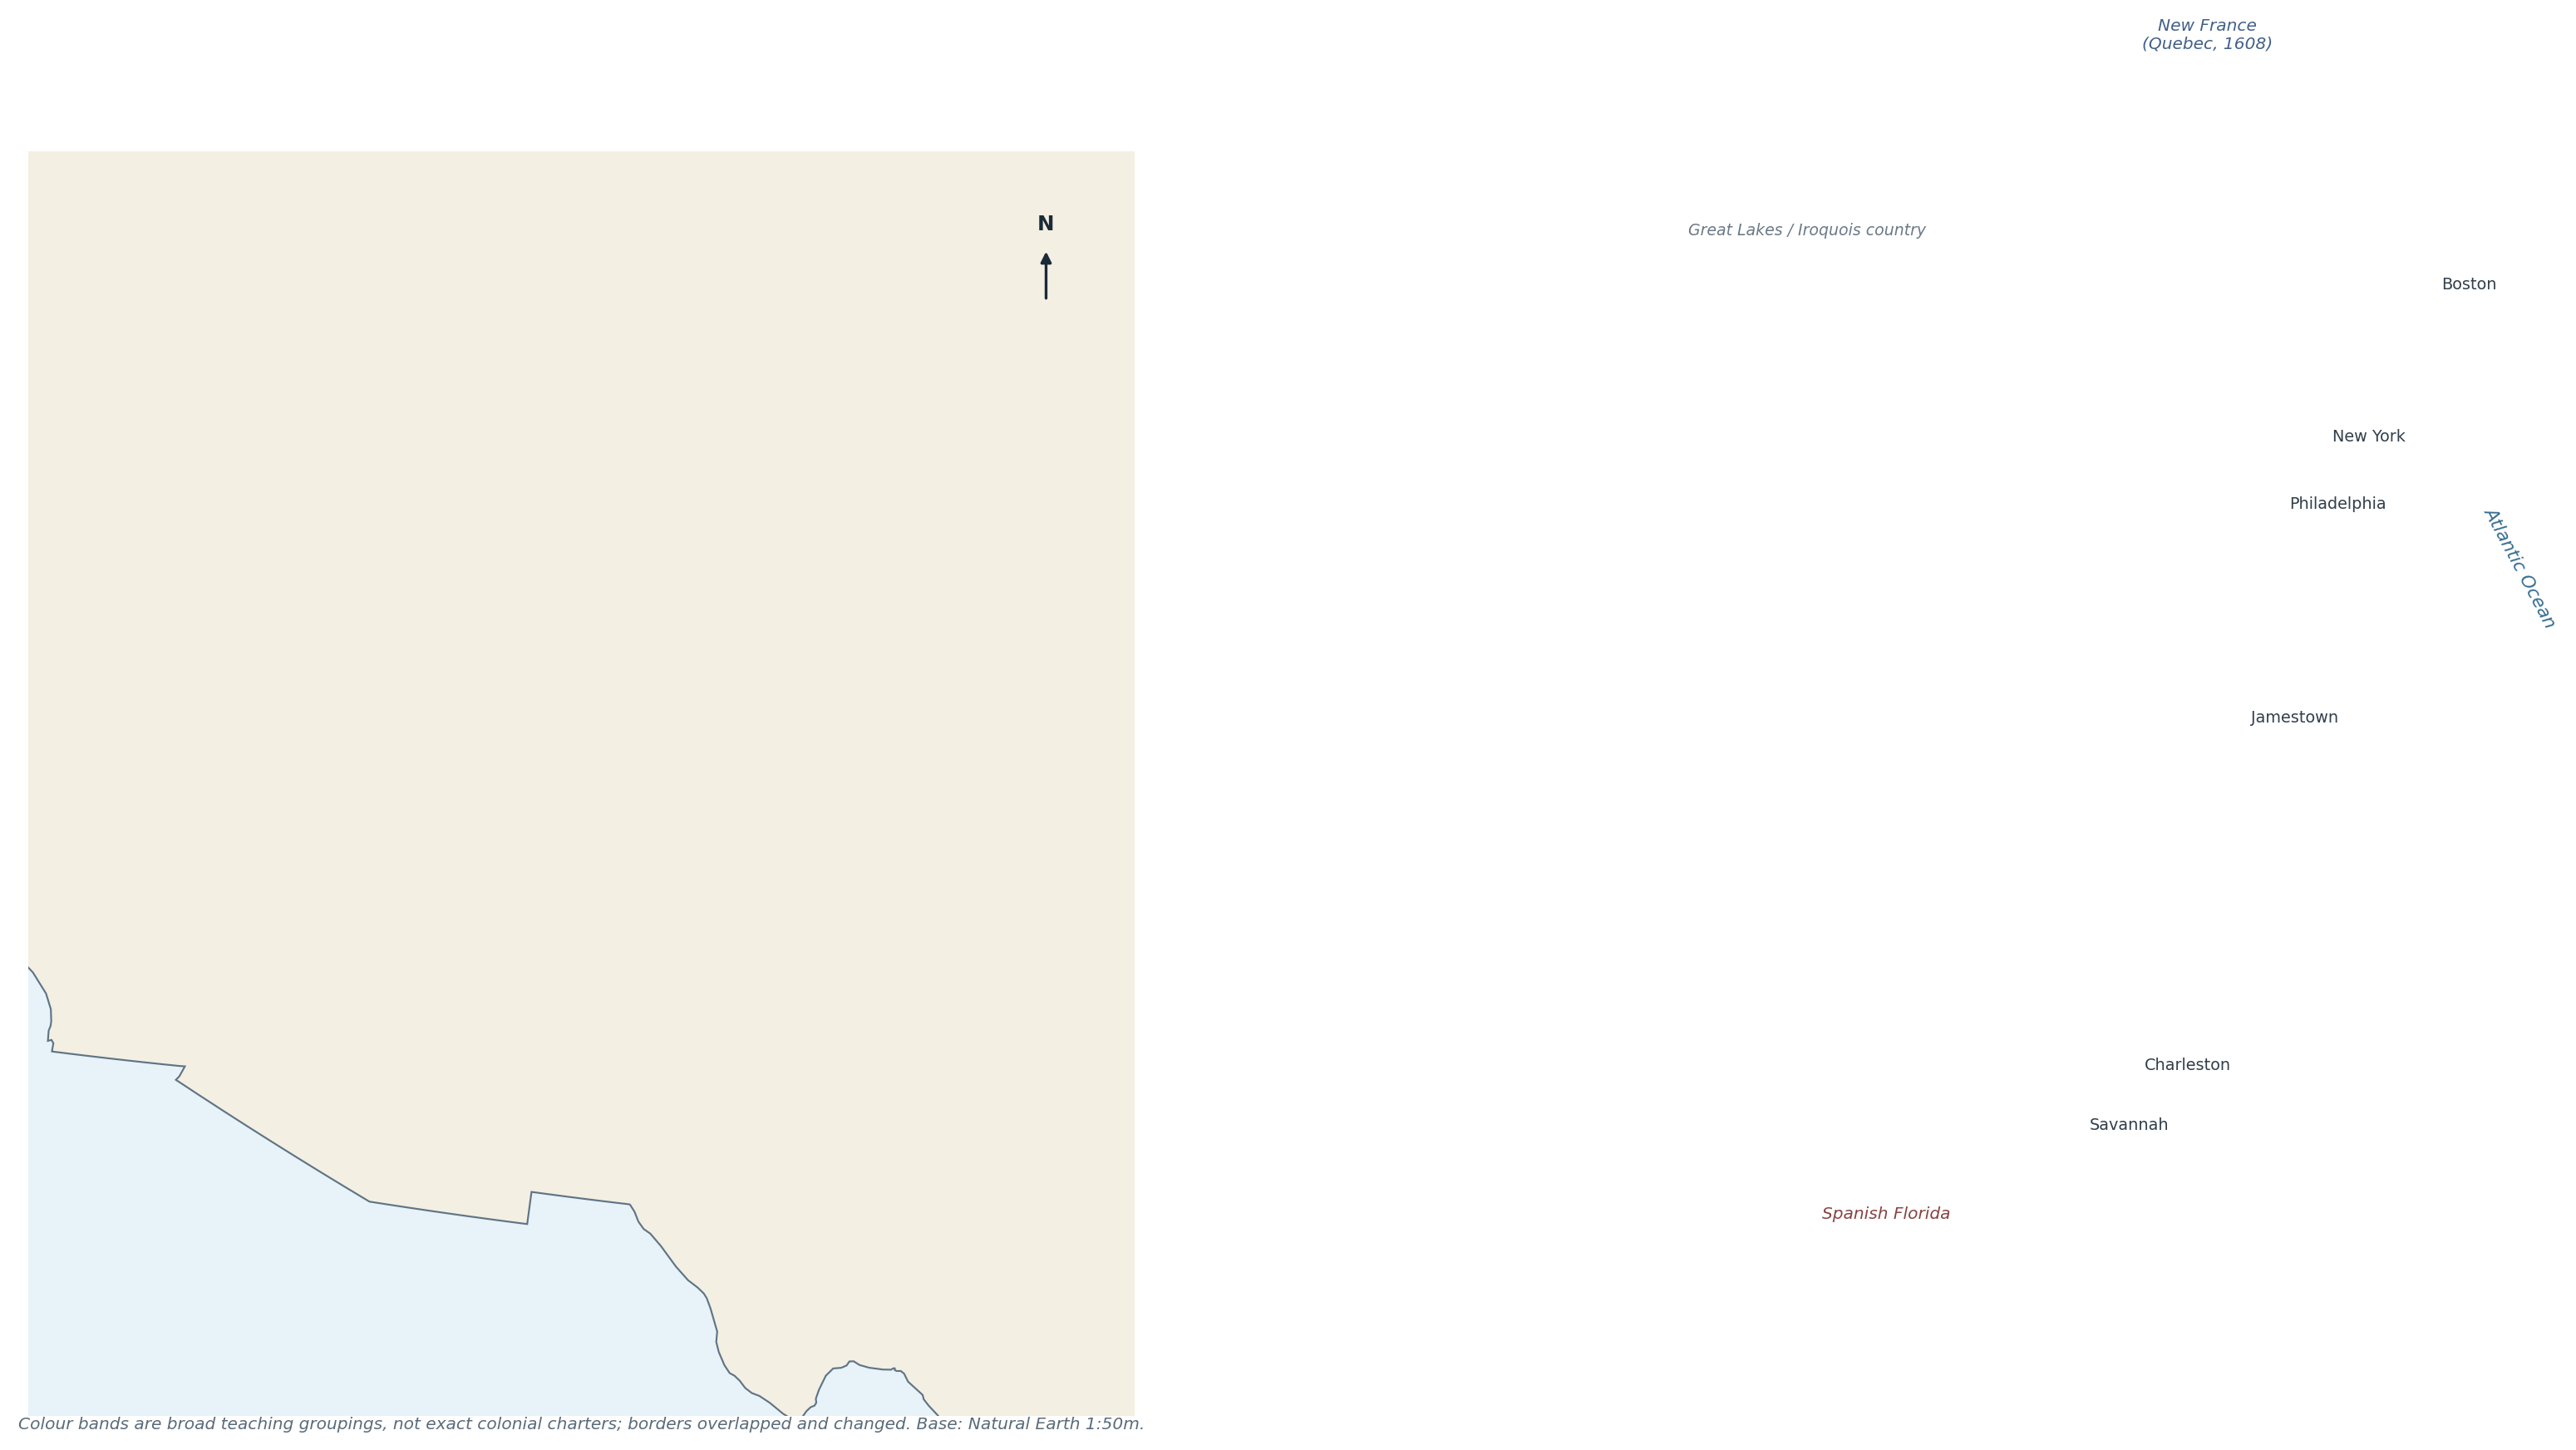
Figure 8.2 The Thirteen Colonies grouped into New England, Middle and Southern colonies. Base map: Natural Earth; groupings after pp 35 and 43.
"CHECK & CORRECT — DATES AND SLAVERY" The p 35 reading contains dated claims that simplify a complex history (e.g. the first enslaved Africans in Virginia, 1619). Keep the date but attribute it: "the reading states…". The p 43 margin note mentions cotton, but the printed text lists rice, lumber, meat for Carolina — cotton became dominant later, so do not project it backwards. |
8.5 Immigration, industrialisation and culture (p 56)
- Timeline: early Europeans 1500s–1700s; westward expansion and immigration 1800s; Revolution 1775–1783; Industrial Revolution labour demand; 1882–1914 ~20 million immigrants; Dust Bowl 1930s.
- Push factors: war, persecution, poverty, famine.
- Pull factors: jobs, land, religious tolerance, freedom.
- Cultural impact: languages, religions, foods, festivals and city neighbourhoods; conflict and assimilation alongside diversity.
- The Northeast absorbed most European immigrants; the South had a different mix, including enslaved Africans and later internal migration.
"CHECK & CORRECT — THE IMMIGRATION TOTAL" The ~20 million figure for 1882–1914 is a class-note approximation. Use it as "about 20 million", attributed to the class timeline, not as an exact census number. |
8.6 Tim Marshall: reading an argument (pp 45–48, 63)
The Prisoners of Geography extract argues that the USA is extraordinarily well placed: fertile soil, navigable rivers, cheap water transport, protective oceans, and few hostile neighbours. The student answer on p 45 earned full marks by:
- naming the theme (HEI);
- giving evidence from the text (quotes);
- explaining the link (rivers → cheap transport → trade → wealth);
- keeping the argument organised.
"AUTHOR'S ARGUMENT ≠ PROVEN FACT" Marshall's claim that the USA is the "wealthiest country" and has "the most navigable rivers" is an author's judgement, not a measured statistic. Use it as evidence of a viewpoint, and separate it from historical facts such as the Louisiana Purchase (1803, $15 million) or the 1819 Transcontinental Treaty. |
8.7 Self-test
1. When and how did the first people reach North America?
2. Name five Indigenous cultural regions and one adaptation for each.
3. Compare Indigenous and European land use in one paragraph.
4. Match Columbus, Cortés, Cartier and Cabot to their sponsors and achievements.
5. Name the thirteen colonies and group them.
6. Why was Maryland founded? Why Georgia?
7. Give three push and three pull factors for immigration.
8. Why is the Mississippi important to Marshall's argument?
9. Distinguish the author's opinion from historical fact with one example.
CHAPTER 9
Dust Bowl, Conservation & Human–Environment Cases
Natural and human causes · drought vs Dust Bowl · migration · national parks and displacement
Source pages: pp 7, 25–26, 52, 55–56
The Dust Bowl of the 1930s is the packet's best example of combined natural and human causes. It is also a warning: the same land can be farmed sustainably or destroyed, depending on how people treat the soil.
9.1 Causes
Natural causes | Human causes |
Long drought in the 1930s | Ploughing of grassland that held the soil |
Hot, dry, windy climate | Overgrazing by cattle and sheep |
Semi-arid Plains with light soils | Removal of vegetation and deep ploughing |
Wind erosion of bare, dry soil | Wheat expansion during high prices; no soil conservation |
The plains had been grassland for thousands of years; the grass roots held the soil. When the grass was removed and drought struck, the wind lifted the topsoil into enormous dust storms ("black blizzards") that darkened the sky and carried soil as far as the East Coast.
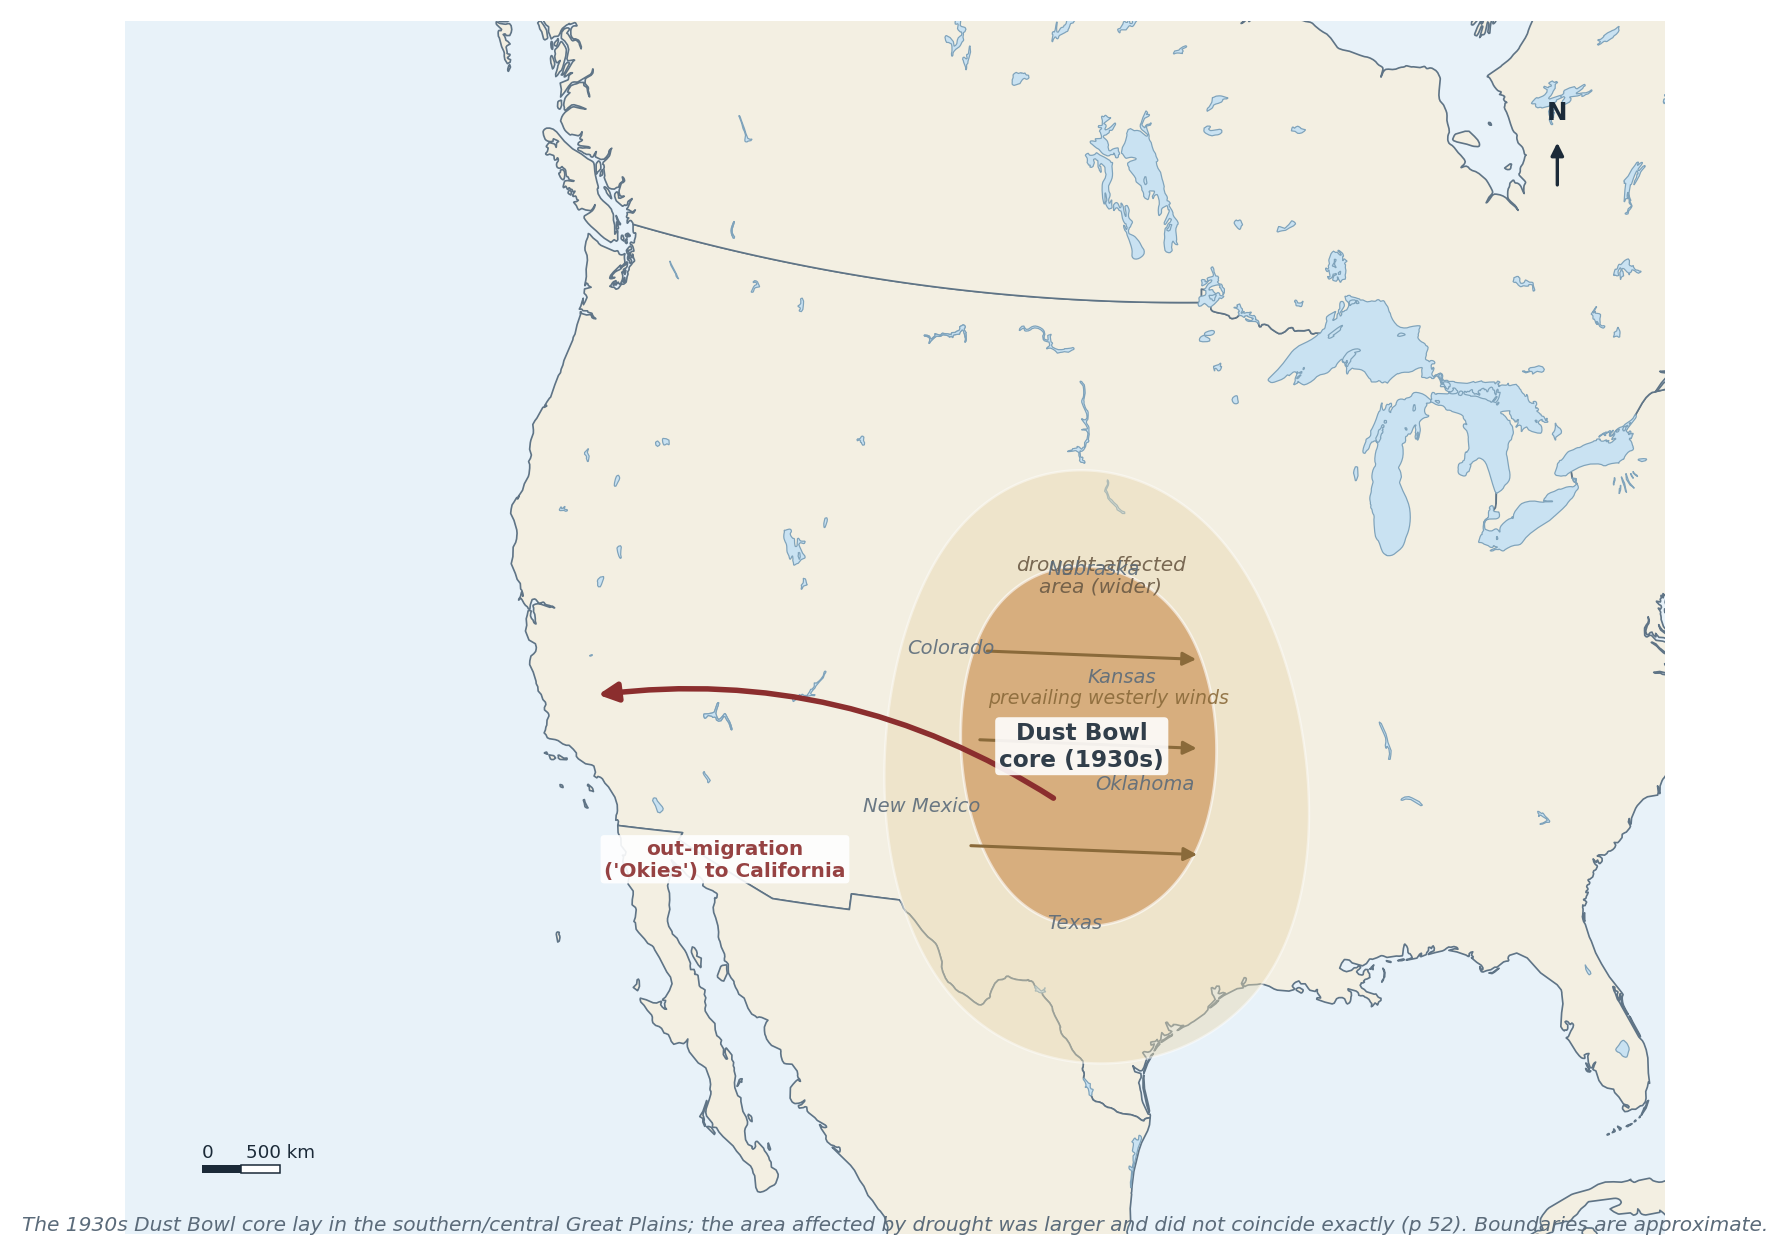
Figure 9.1 The Dust Bowl core and the wider drought-affected area, with prevailing winds and out-migration. After pp 25–26 and 52.
"CHECK & CORRECT — WHICH CAUSED WHICH?" The p 26 student answer says the Dust Bowl caused droughts. That reverses cause and effect: drought was a cause, and the Dust Bowl was the result of drought acting on exposed soil. Dust storms can affect local rainfall slightly, but they did not create the 1930s drought. |
"CHECK & CORRECT — DROUGHT AREA ≠ DUST BOWL" p 52 is explicit: the area of the worst 1930s drought was not the same as the Dust Bowl region. The Dust Bowl core was in the southern/central Great Plains (Texas, Oklahoma, Kansas, Colorado, New Mexico); drought affected a much wider area. Do not shade one polygon for both. |
9.2 Consequences
- Soil: topsoil blown away; fertility lost; some land abandoned.
- Farming: crops failed; farms foreclosed; debt.
- People: mass out-migration — especially to California ("Okies"); migrant camps; family separation.
- Economy: the Depression deepened; banks failed.
- Health: dust pneumonia, eye and throat problems.
9.3 Conservation and recovery
- Contour ploughing, terracing, strip cropping, cover crops and shelterbelts of trees to break the wind.
- Rotating crops and resting land.
- Soil conservation districts and federal advice (1930s onwards).
- Irrigation — but over-irrigation can cause salinisation, so it is not a simple fix.
- Better grazing management and revegetation.
These are the same principles as the soil-conservation list in Chapter 5 (p 7): keep the soil covered, slow the water, break the wind.
9.4 National parks and Indigenous displacement (pp 52, 55)
- Yellowstone (1872) was the world's first national park. It protected a spectacular landscape — and it also removed Shoshone and other peoples from land they had used for generations.
- The park was presented as "wilderness", although it had been managed and used by Indigenous people.
- Shoshone people were displaced, lost access to hunting and sacred sites, and have campaigned for recognition and return.
- This is a HEI case with a clear power dimension: conservation benefits one group and costs another.
- The GD / DV / BC initials on p 52 remain unexpanded (see Chapter 6), so no park-specific detail is added beyond uplift and erosion.
"ANSWER THE 'WHO BENEFITS?' QUESTION" A strong parks answer names who gained (tourists, the nation, wildlife), who lost (displaced Indigenous communities), what changed (access, land use, law) and what is contested (return of land, interpretation, "wilderness"). |
9.5 Worked example
"EXAMPLE — NATURAL PLUS HUMAN CAUSES" "Explain why the Dust Bowl happened." Write a paragraph using both natural and human causes, and link them. Answer. The Great Plains are semi-arid, with light soils and strong winds; grassland roots normally hold the soil. In the 1920s high wheat prices encouraged farmers to plough millions of hectares of grassland, and cattle overgrazed the rest. When the 1930s drought arrived, the exposed, dry soil had nothing to bind it, so the wind removed the topsoil in dust storms. The drought was natural; the vulnerability was human-made. Neither alone would have produced the Dust Bowl. |
9.6 Self-test
1. Give three natural and three human causes of the Dust Bowl.
2. Why did removing the grass matter so much?
3. Correct the statement "the Dust Bowl caused the drought".
4. How did the Dust Bowl region differ from the drought area?
5. Name four soil-conservation methods.
6. What were the effects on people?
7. Why is Yellowstone a HEI case as well as a conservation success?
8. Who was displaced, and why does it matter?
CHAPTER 10
Exam Skills & Revision Toolkit
Question types · command words · diagram and map technique · writing structures · self-test planner
Source pages: pp 13, 20, 39–40, 44–45, 51, 53–55, 62, 64–65
The exam scope (p 53) says all topics and lists the question formats: multiple choice, cognitive grouping, gap-fill, geographic skills (diagramming, mapping, image analysis) and short written analysis. This chapter is about how to answer each one, not what to learn.
10.1 Question types and how to attack them
Type | What it tests | Method |
Multiple choice | Recognition and elimination | Read all options; eliminate two; check the exact wording of the remaining two |
Gap-fill | Precise terminology | Use the word bank; check grammar and units |
Cognitive grouping | Classification | Name the criterion first, then place every item; do not leave an item out |
Mapping | Location and labels | Use the grid, north arrow and scale; label neatly with leader lines |
Diagramming | Process and structure | Label all parts, add arrows for direction and a key |
Image analysis | Observation and inference | Say what you see, then what it means; separate evidence from interpretation |
Short written analysis | Explanation and judgement | Point → Evidence → Why → Link/Conclusion |
"EXAMPLE — COGNITIVE GROUPING (P 54)" Group: wind, plants, gravity, glaciers, ice, rivers. Wrong grouping: "things that erode" (everything). Right grouping: agents of erosion — wind, gravity, glaciers, rivers — and processes/biological factors — plants (root wedging, weathering). Always state the criterion: "I am grouping by whether the item is an agent that transports material or a process that breaks rock." |
10.2 Command words
- State / name — one word or phrase, no explanation.
- Describe — say what it is like, with detail and location.
- Explain — give because, mechanisms and links.
- Compare — both sides, like with like.
- Evaluate / judge — weigh both sides and decide.
- To what extent — accept a partial truth, then qualify it.
10.3 Writing structure: Point–Evidence–Why–Link
The p 55 model:
1. Point — answer the question in one sentence.
2. Evidence — a fact, figure, place or quotation.
3. Why — explain the mechanism or significance.
4. Link / Conclusion — return to the question and judge.
Worked paragraph (p 45 style, Suggested):
"The USA's rivers were central to its economic rise. The Mississippi–Missouri–Ohio system drains the interior and carried grain, coal and people cheaply to the Gulf (evidence). Because bulk goods are far cheaper by water than by road, farmers could sell at a distance and cities could grow at the river junctions (why). This advantage, combined with fertile soils and protective oceans, helps explain the country's rapid economic growth (link)."
"FOUR-MARK SHORT ANSWERS" One mark per element: point, evidence, explanation, link. If the question says "use an example", name a specific place — not "a country" or "some volcanoes". |
10.4 Diagram and map technique
- Diagram: title, labels, arrows for direction/process, key if colours are used, and a note of scale if relevant. Never leave a label unconnected.
- Map: title, key, north arrow, scale, and neat labels with leader lines where space is tight.
- Image analysis: first the obvious (what is it?), then the geographical (process, direction, evidence), then the limitation (what can't you tell from the image?).
10.5 The revision plan
1. Cover the chapter, then recall the five-part structure from memory.
2. Redraw each figure from memory, then compare labels.
3. Do the self-test closed-book, then mark with the answer key.
4. Re-teach the weakest section aloud in two minutes.
5. Practice the two long answers (St Helens five themes; Dust Bowl causes) under time.
"CHECK & CORRECT — TEACHER TICKS ARE NOT ALWAYS RIGHT" The packet's marked answers contain errors (p 10 San Andreas, p 20 ridge direction, p 26 drought causality, p 34 radius, p 53 date line). Marks show what the teacher accepted at the time, not what is scientifically correct. Use the Check & correct boxes in this book. |
10.6 Exam-day checklist
- Read the command word twice.
- Underline the case study or place named.
- For "explain", write because at least twice.
- For "compare", use both and whereas.
- For data/diagram questions, quote numbers and directions.
- Leave time to check units (km, cm, °, %, million years).
10.7 Self-test
1. Match each question type to one revision strategy.
2. What is the difference between "describe" and "explain"?
3. Write a Point–Evidence–Why–Link paragraph about any hazard.
4. What are the five parts of a good diagram?
5. How would you answer "to what extent"?